
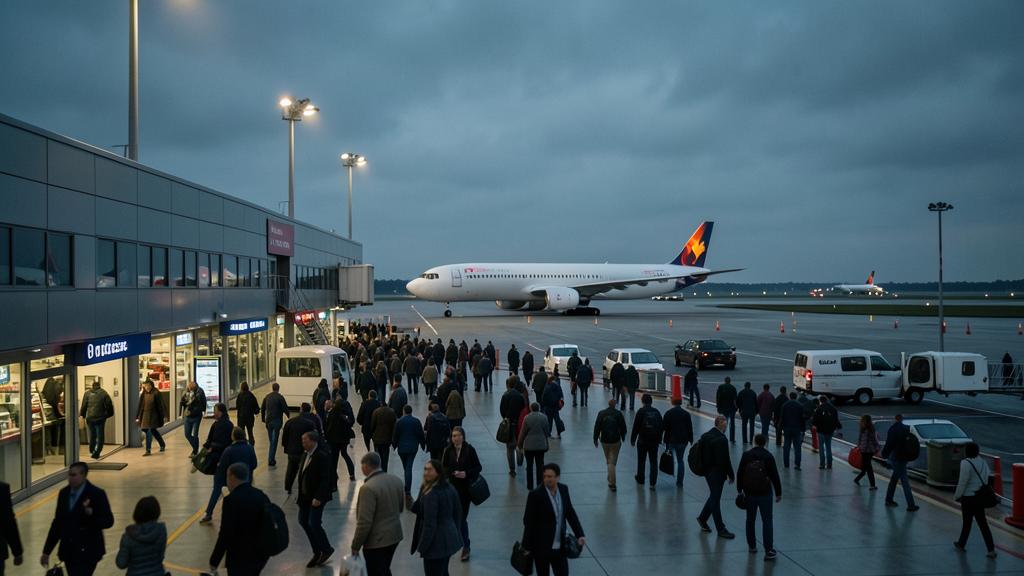
A traffic release showing movements down and passengers up reads, to most readers, as good news twice over: less congestion, more business. Inside an airport it reads as two problems drifting in opposite directions. One counter measures how often the runway and the controller are asked to work. The other measures how many people walk through a building sized years ago on an assumption about the first counter. When the two diverge, the queues and the capital move somewhere the master plan did not put them.
Two counters, two different questions
An aircraft movement is an event on a runway: one take-off, or one landing. A commercial turnaround therefore generates two of them, which is why the same airport can be described as handling two hundred thousand movements or one hundred thousand flights depending on who wrote the sentence. Check the definition before comparing any two figures — some national series count movements, some count flights, and a few count only commercial air transport while others fold in general aviation, training circuits, positioning legs and state flights.
A passenger is an event in a terminal, and here too the definition does the heavy lifting. A transfer passenger — one who changes aircraft — is counted twice in an arrivals-plus-departures total, once each way. A direct transit passenger, who stays aboard while the aircraft turns round, may be counted once, excluded, or reported separately, depending on the publisher. Those conventions are not a rounding error at a hub with a heavy connecting bank, because a transfer passenger consumes gate seating, a security process and airside concessions but never touches the kerb, the check-in hall or arrivals baggage reclaim — so a total that mixes the categories describes no building in particular.
The two counters therefore do not offer two views of one thing. They measure different loads, on different parts of the airport, from different customers — the airline, which buys runway and stand access, and the passenger, who occupies floor space and processor time.
The identity that produces the divergence
Nothing mysterious sits behind a movement-down, passenger-up release. Passengers carried are, to a very good approximation, the product of three terms: the number of movements, the average number of seats offered per movement, and the proportion of those seats filled. Growth can come from any of the three, and only one of them is cheap.
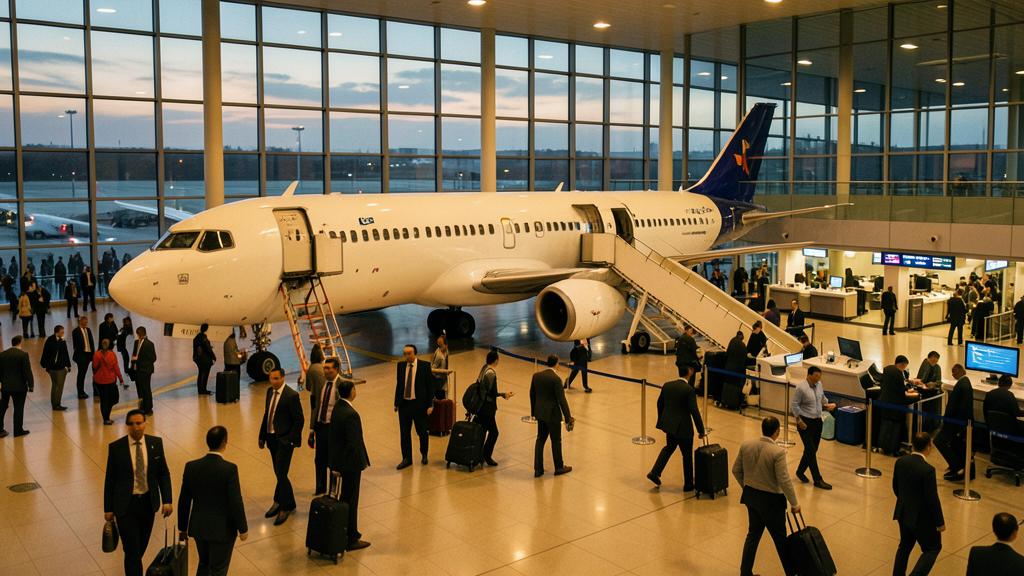
Load factor has a practical ceiling. Once a network is filling most of the seats it offers, the remaining headroom is structural — the empty seats are on the wrong flights at the wrong hours, and squeezing them out costs revenue management more than it earns. Movements have a ceiling too, but a physical one: runway system capacity, airspace design, environmental caps, night restrictions. The remaining term, average seats per movement — the gauge, or module — is the one an airline can move unilaterally, one fleet decision at a time. It is the one that has been moving.
Up-gauging is what an airline does when it wants more passengers at an airport where it cannot get more movements. The decision is rational at the airline and lands as a set of unfunded consequences at the airport, because almost nothing in an airport is sized on passengers alone or on movements alone.
| Subsystem | Sized mainly by | Largely indifferent to |
|---|---|---|
| Runway system, taxiways, holding points | Movements per hour, and the fleet mix behind them | How many people are aboard |
| Tower and approach staffing, sector design | Movements and traffic complexity | Seats offered, load factor |
| Stands, apron, jet bridges | Aircraft size and turnaround duration | Movement count on its own |
| Check-in, security, border control | Peak-hour originating passengers | Movements, transfer passengers |
| Hold rooms, gate seating, airside retail | Peak-hour departing passengers, transfers included | Aircraft mass |
| Baggage handling and reclaim | Peak bags per hour, and the largest single arrival | Average daily totals |
| Ground handling, de-icing, fuelling | Aircraft size and simultaneity | Load factor |
When airlines use bigger planes (up-gauging) to carry more passengers without increasing the number of flights, it creates problems for airports. Runways and air traffic control handle fewer flights but with larger, heavier aircraft, which can reduce overall capacity. Meanwhile, terminals and ground services must handle more passengers in fewer, larger groups, leading to longer queues and delays.
At a major European hub, an airline replaces 10 daily A320 flights (180 seats each) with 6 A350 flights (350 seats each). The airport’s movement count drops from 20 to 12, but passenger numbers rise from 1,800 to 2,100 per day. The runway system struggles with wider spacing between larger aircraft, while the terminal faces peak-hour congestion as passengers arrive in fewer, larger groups.
What a movement actually loads
Runway capacity is not a fixed number of movements per hour; it is a number that depends on what is flying. Wake turbulence separation minima are applied on the basis of the leading and following aircraft categories, and the spacing required behind a heavier aircraft is greater than behind a lighter one. Recategorisation schemes now in use at several major airports refine those categories to recover spacing that the older, coarser grouping wasted — but the direction of the underlying physics does not change. A heavier average leader means, all else equal, a wider average gap.
Runway occupancy time works the same way. A larger aircraft on landing typically vacates later, both because the roll is longer and because it needs a rapid-exit taxiway sized for it. On departure, the take-off roll and initial climb profile of a heavy aircraft at high weight can constrain the following departure more than a light one would. The result is uncomfortable for anyone reading the traffic release as good news: part of the fall in movements may not be an airline choosing bigger aircraft freely, but the runway delivering fewer movements per hour because the mix got heavier.
Air traffic control workload follows the same counter. A controller works aircraft, not passengers. Two hundred people on one aeroplane and two hundred on two are the same traffic for an airline and very different workload in a sector — which is precisely why up-gauging is, from an air navigation service provider’s point of view, capacity relief.
The trap. Reading a fall in movements as spare runway capacity. Where the fall is driven by a heavier fleet mix, the declared hourly capacity may have fallen with it. Any capacity claim built on a movement count alone, without the mix that produced it, will be contradicted the first time the airport tries to sell the headroom.
What a passenger actually loads
Terminals are sized on peaks, not averages, and the peak that matters differs by process. Check-in and bag drop are driven by originating passengers arriving in the two or three hours before departure. Security is driven by the same population compressed into a narrower window. Border control on arrival is driven by aircraft touching down in a bank — which is why an immigration hall can fail on a day with fewer movements than usual. The movements arrived together, and each carried more people.
That is the whole story of up-gauging inside a terminal. The arrival of passengers is not smoothed by the fall in movements; it is made lumpier. A hall dimensioned for a steady trickle of medium aircraft receives the same daily total in fewer, larger slugs, and every queueing process degrades non-linearly as arrivals become burstier. The average is unchanged. The worst waits, which are what passengers notice and what service-level standards are written against, get longer.
Baggage is the clearest case. A reclaim belt is not dimensioned by daily bag volume but by the largest number of bags that can be presented at once, and by how long they sit before collection. Two medium arrivals half an hour apart share a belt comfortably. One large arrival with the same total bag count does not, because the presentation is simultaneous and the belt has a finite perimeter. On the departure side, the sortation peak and the number of make-up positions are set by simultaneity, not by throughput.
What aircraft size loads on its own
Between the runway and the terminal sits the part of the airport that responds to neither counter: the stand. Aerodrome infrastructure is dimensioned by the reference code of ICAO Annex 14, whose second element is a letter reflecting wingspan and outer main gear wheel span. Moving up a code letter is not a matter of repainting a stand. It changes required taxiway width and separation, stand clearances and apron layout, sometimes the number of jet bridges, and it usually consumes more than one former stand to create one new one — so a fleet that grows a code letter can reduce the number of aircraft an apron holds even as it increases the number of passengers those aircraft bring.
Turnaround duration also rises with size: more passengers to board, more bags to load, more fuel to uplift, more catering, more cleaning. A stand therefore supports fewer rotations per day, and stand occupancy — not stand count — becomes the binding constraint. Ground handling manpower per turn rises as well, though less than proportionally, which is exactly why handlers welcome up-gauging and airports do not always share their enthusiasm.
Crewing scales with seats rather than with flights. Under the European rules the minimum number of cabin crew follows the seats installed, not the passengers actually carried, so a lightly loaded large aircraft still carries the full complement. United States rules reach a broadly similar result through a bracketed table based on seating capacity, and the arithmetic diverges at the margins between the two systems. Either way the driver is the cabin, not the flight.
Slots: the mechanism that manufactures up-gauging
At a coordinated airport, what an airline holds is a slot: permission to use the full range of infrastructure at a specified date and time. A slot is granted per movement. It is not granted per seat, per passenger or per tonne. That single design choice is the most powerful up-gauging incentive in the industry, because once an airline has exhausted the slots it can obtain, the only way to carry more people is to make each slot carry more.
The usage rules reinforce it. Historic precedence — the right to keep a series of slots into the next equivalent season — depends on having operated that series to a defined threshold, conventionally set high enough that a carrier cannot sit on unused slots. Value attaches to the movement, not to the traffic it carries, and a scarce slot pushes an airline towards the largest aircraft it can profitably fill in that window. Airports publishing a movement cap, whether for environmental or infrastructure reasons, should expect passenger numbers to keep growing under it for years, and should size their terminals accordingly.
Where the cap is expressed in noise rather than in movements — a quota budget in which each aircraft type consumes points according to its certificated noise performance — the incentive changes shape again. A quieter large aircraft can be preferable to two noisier small ones under a noise budget while being worse under a movement cap. The instrument chosen determines the fleet the airport gets.
The revenue mix moves too
Airport charges are typically split between an aircraft-related component, most often assessed on maximum take-off mass, and a passenger-related component levied per departing passenger. Up-gauging raises both, but not in the same proportion, and it changes what the airport is selling. Fewer, heavier aircraft means aeronautical revenue concentrated in fewer transactions with fewer counterparties — a commercial risk as much as an operational one, since the loss of one rotation now removes more revenue than it used to.
The airline side of the ledger explains the behaviour. En-route charges in the Eurocontrol route charges system scale with a weight factor built as a square-root function of maximum take-off mass, so doubling the mass does not double the charge; per seat, the larger aircraft is cheaper. Crew cost per seat falls, fuel per seat falls, and the fixed cost of one movement is spread across more revenue. Every incentive in the cost structure points the same way, and none of them points at the terminal that absorbs the result.
The right reflex. Never compare two traffic series without checking three definitions first: movement or flight, total or terminal passengers, and whether general aviation, training, positioning and cargo flights are included. Most apparent contradictions between an airport’s figures and a national statistics office’s figures dissolve at that step, and the ones that do not are worth investigating properly.
Reading the divergence as a planner
The practical consequence is that a single headline number is not a planning input. An airport whose movements are flat and whose passengers grow four per cent a year has a terminal problem and no runway problem, and will waste money if it builds symmetrically. An airport whose movements grow while gauge falls — the shape produced by a new low-cost base flying smaller aircraft at high frequency, or by a regional network being rebuilt — has the opposite problem, and a terminal expansion will sit half empty while the runway queues.
Three derived measures do more work than either headline. Average seats per movement, tracked by hour rather than annually, shows where in the day gauge is actually rising. Peak-hour passengers per movement shows whether the terminal peak is driven by more flights or by bigger ones. Transfer share separates the passengers who load the whole building from those who load only the airside half. None of the three is exotic; all three are routinely absent from the documents that justify capital spending.
| Movements | Passengers | What is probably happening | Where the pressure lands |
|---|---|---|---|
| Down | Up | Up-gauging under a slot, runway or environmental constraint | Terminal processors, baggage, stands, code-letter compliance |
| Up | Up faster | Growth plus up-gauging — the unconstrained case | Everything, but the terminal fails first |
| Up | Up slower | Falling gauge or load factor: new entrant, thinner routes, regional network rebuilt | Runway, ATC staffing, stand count rather than stand size |
| Flat | Flat, gauge rising | Load factor falling — a commercial warning, not a capacity one | Airline margins; the airport sees it a season later |
What it means on shift
For a controller the change is mostly welcome: fewer aircraft, wider spacing behind each. For a ramp supervisor it is a step change in simultaneity — fewer turns per shift, each bigger, each less forgiving of a late bag or an unserviceable loader. For a duty terminal manager it is the certainty that the day will be shaped by four or five arrival slugs rather than by a smooth curve. And for anyone reading the annual report, it is a reminder that the two numbers on the front page were never measuring the same thing. How these loads land in practice, and how different airports have handled the code-letter problem, is discussed regularly in the operations sections of the FL330 professional forums.


Leave a Reply
You must be logged in to post a comment.