

Every engine programme arrives at a trade show with a time-on-wing figure attached to it, and the figure is almost never wrong. It is simply the answer to a question that was asked on a stand, in a controlled mission, on a first-run engine, in air that carried nothing but air. Your network asks a different question. The gap between the two numbers is not marketing: it is the sum of the assumptions the brochure did not repeat, and every one of them is knowable in advance.
What the number on the stand is actually measuring
Time on wing is the interval between an engine being installed and being removed, counted in engine flight hours, engine flight cycles, or both. That single sentence hides three decisions the person quoting the figure has already made for you: which removal counts, which engines are included in the population, and which mission they flew.
A catalogue figure normally means the interval to the first shop visit, on a fleet of engines that were new when they were installed, excluding removals caused by foreign object damage or by anything the manufacturer classifies as not attributable to the design. It is an average, and it is frequently the average of the operators who fly the engine in the mission it was optimised for. None of that is dishonest. It just means the number describes a reference mission, and the reference mission is a document, not a slogan.
The useful reflex is therefore not to distrust the figure but to ask for its basis: hours-to-cycles ratio, thrust rating and average derate, ambient conditions, environmental severity classification, and whether the population is first-run or mature. Every one of those items exists in the engine manufacturer’s workscope planning guide or in the operating and maintenance data that comes with the powerplant. The gap between catalogue and reality is mostly the distance between your operation and that reference.
Cycles do the damage, hours pay the bill
The single most consequential difference between two operators of the same engine is the ratio of flight hours to flight cycles. A long-haul operation running eight to ten hours per cycle and a regional operation running a little over an hour per cycle can burn the same annual hours and accumulate wildly different wear, because almost all of the thermal punishment is concentrated in the few minutes of takeoff and initial climb.
The reason is physical. Turbine gas temperature peaks at takeoff thrust; the high-pressure turbine blades and the combustor sit at their design limit for that period and rarely anywhere else in a normal flight. Cruise, however long, is comparatively gentle. Each additional cycle therefore adds a full dose of hot-section exposure and a full thermal transient — heat-up, soak, cool-down — which is what drives low-cycle fatigue in the rotating parts and coating distress in the hot section.
This is why quoting time on wing in hours alone is nearly meaningless across mission types. An engine that reaches a given number of hours on a long-haul network may have seen a third of the cycles of the same engine on a short-haul network, and the cycle count is the one that determines when the life-limited parts run out and when the exhaust gas temperature margin closes.
The right reflex: before comparing your fleet against any published figure, normalise both to the same basis. Convert to hours per cycle, state the average derate you actually achieve, and note the environmental class of your main bases. Two of those three numbers are already in your flight data; the third is a question for your maintenance provider.
The reference mission, item by item
What follows is the anatomy of the assumption set. Each line is a place where a network can diverge, and the divergences compound rather than add — a short sector flown at full thrust into a dusty airfield is worse than the sum of its three parts, because reduced margin makes the next hot day the one that forces the removal.
| Assumption in the reference mission | Why it matters | What a short, hot, dusty network does to it |
|---|---|---|
| A high hours-to-cycles ratio | Spreads the hot-section exposure over more airborne time and delays life-limited part expiry | Ratio collapses; cycles accumulate several times faster per hour flown |
| Substantial average thrust reduction on takeoff | Turbine temperature falls sharply for a modest thrust reduction, and margin consumption falls with it | Short runways, obstacles, high elevation and high temperatures eat the available reduction, sometimes down to zero |
| Moderate ambient temperature | Flat-rated engines hold rated thrust up to a break temperature; above it, turbine temperature climbs | Operating above the flat-rating break for much of the year moves every takeoff closer to the limit |
| Clean air | The compressor and hot-section models assume ingestion is negligible | Sand, dust and industrial particulates erode the compressor and attack turbine coatings |
| First-run engines | New parts, new clearances, full exhaust gas temperature margin | Says nothing about the second or third run, which is where most fleets spend most of their life |
| Removals attributable to wear only | Isolates the deterioration mechanism the engineers wanted to characterise | Real fleets remove engines for damage, oil consumption, vibration and borescope findings too |
The time-on-wing figure in the brochure is based on ideal conditions. Real-world operations—short flights, hot weather, dusty airfields—make engines wear out faster. The brochure number is a starting point, not a guarantee.
An Airbus A320neo flying 2-hour regional sectors in Dubai (hot, dusty) may see engines removed after 15,000 hours, while the same engine flying 3-hour sectors in a cooler European climate might last 30,000 hours. The mission type changes everything.
Dust does two different things, and only one of them is obvious
Operators in dusty environments talk about erosion, and erosion is real: particulate abrades compressor airfoils, blunts leading edges, roughens surfaces and opens up blade tip clearances. The consequence is a loss of compressor efficiency, which means more fuel is needed to deliver the same thrust, which means a higher core temperature, which means exhaust gas temperature margin is consumed faster. That chain is mechanical and gradual, and part of it is recoverable — periodic compressor water washing restores some of the lost efficiency and some of the margin, which is why wash intervals are shorter in severe environments.
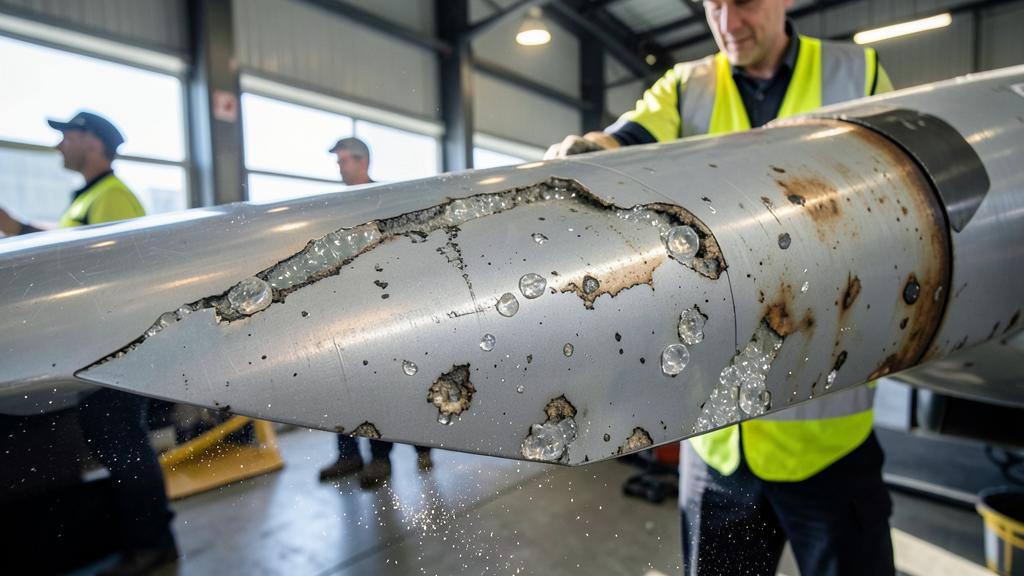
The second mechanism is not recoverable and gets far less attention. Fine mineral dust that survives into the hot section melts at turbine temperatures and deposits as a glassy calcium-magnesium-aluminosilicate layer on thermal barrier coatings. The molten deposit infiltrates the porous coating, and on cooling the mismatch in thermal expansion causes the coating to spall. Once the barrier is gone, the metal underneath runs hotter than it was designed to run, and the blade’s life shortens in a way no wash can reverse. Volcanic ash is the acute version of the same chemistry; ordinary desert dust is the chronic version.
The practical distinction matters when you plan. Erosion argues for washing and for filtration discipline on the ground. Coating attack argues for a different workscope at the shop visit and for a realistic expectation that the restored margin after overhaul will be smaller than the margin the engine left the factory with.
The trap: ground time is not free time. A high-thrust run-up on a dusty apron draws a ground vortex that feeds the core directly, and taxi with reverse selected on an unswept surface does the same. Some of the most severe ingestion in a short-sector operation happens with the aircraft below flying speed, which is precisely the part of the cycle that never appears in a mission profile.
What actually triggers the removal
Time on wing ends for one of a small number of reasons, and they respond to entirely different levers. Treating them as a single quantity is the most common analytical error in fleet planning, because the mitigation that helps one does nothing for another.
| Driver | What it is | What extends it | What does not |
|---|---|---|---|
| Exhaust gas temperature margin exhaustion | Deterioration has closed the gap between operating temperature and the certified limit, so the engine can no longer produce rated thrust on a hot day | Derate, washing, clean air, restoring clearances at the shop visit | Buying cycles back — the margin is a condition, not a counter |
| Life-limited part expiry | A rotating part has reached the cycle limit published in the airworthiness limitations section | Nothing operational. The limit is mandatory and counted in cycles | Derate, washing, a gentle mission — the counter increments regardless |
| Unscheduled removal | Foreign object damage, bird strike, oil consumption, vibration, borescope finding, a fault the troubleshooting cannot clear on wing | Ground handling discipline, apron condition, on-wing repair capability | Mission profile assumptions of any kind |
| Opportunity removal | The engine is removed early because a shop slot, a lease return condition or a fleet plan makes it the cheapest moment | Contract structure and planning | Engineering — this is a commercial decision wearing a technical coat |
Two of those four are cycle counters that no operating technique will slow. That is why an operation with a low hours-to-cycles ratio can find its engines coming off for part expiry while the performance is still perfectly healthy — and why a brochure figure quoted in hours can be met and be irrelevant at the same time.
First run, second run, and the shape of the curve
Deterioration is not linear. A new engine loses a noticeable slice of its margin quickly, during the initial period when clearances bed in, then settles into a slower and fairly steady decline. This is normal, expected and built into the manufacturer’s curves — but it means that extrapolating from the first months of service will always be pessimistic, and extrapolating from a mid-life plateau will always be optimistic.
The more important discontinuity is the shop visit. A performance restoration recovers a large part of the lost margin but rarely all of it, and each subsequent run typically starts from a lower point and therefore ends sooner. A fleet’s average time on wing therefore falls as the fleet matures, even if nothing about the operation has changed. When a lessor, a maintenance provider or a manufacturer quotes a figure, the run number is one of the first things to establish, because a first-run number compared against a third-run fleet is not a comparison at all.
The levers you actually hold
Very little of what determines time on wing is decided in the maintenance organisation. Most of it is decided in scheduling, in performance engineering and in the choice of bases — and then paid for in the shop.
| Lever | Acts on | Real cost or limit |
|---|---|---|
| Reduced-thrust takeoff (assumed temperature method) | Peak turbine temperature, therefore margin consumption | Constrained by runway length, obstacles, contamination and weight; the reduction is capped, and the cap is in the aeroplane flight manual, not in folklore |
| Derated ratings | The same, with the lower rating becoming the basis for the limiting speeds | Available only where the type has certified derates; changes the performance calculation, not just the thrust setting |
| Compressor water washing | Recoverable efficiency loss from fouling and mild erosion | Ground time, water and effluent handling, crew and slot availability; recovers part of the loss, never all of it |
| Engine condition monitoring | Nothing directly — it converts deterioration into a forecast | Requires clean, consistent data and someone who reads the trends before they become findings |
| Route and base allocation | Environmental exposure and hours-to-cycles ratio | Usually owned by commercial planning, which is why engineering has to argue for it in money |
| Shop workscope depth | How much margin comes back and how long the next run lasts | The deeper workscope costs more now and pays later; the shallow one does the reverse |
Reading a published figure without being misled by it
The professional version of this discussion is not a complaint about optimism. It is a translation exercise, and it takes four questions. First: is this interval to first shop visit, or between shop visits, and on which run? Second: what hours-to-cycles ratio underlies it, and what average thrust reduction? Third: which environmental severity class, and does the operator population include anyone flying my kind of network? Fourth: which removals were counted, and which were excluded as non-attributable?
Answer those and the catalogue figure becomes useful — not as a promise, but as a calibrated reference point you can adjust with the severity factors the manufacturer publishes for exactly this purpose. That is what the workscope planning guide is for, and it is the document that gets read least.
The same translation matters commercially. Flight-hour agreements price maintenance per engine flight hour, and the rate depends on assumptions about severity, ratio and derate that are written into the contract. An operation that quietly drifts towards shorter sectors, hotter bases or less available derate is drifting towards a rate revision, and the drift is visible in flight data long before it is visible in an invoice. Bringing that evidence to the table early is a very different conversation from arriving after the escalation clause has been triggered. Engineers who want to compare notes on how their networks translate into real intervals will find the discussion already running on the FL330 forums.
What this changes on Monday morning
Nothing about this analysis requires new equipment or a new contract. It requires that the fleet’s own numbers exist in the same units as the numbers being quoted at it. An operator who can state, for each subfleet, its hours-to-cycles ratio, its achieved average derate, the environmental class of its principal bases and the run number of its installed engines is in a position to predict its own removals within a useful band — and to recognise instantly when a published figure is describing somebody else’s airline.
The engines are not underperforming. They are being asked a harder question than the one on the stand, and the harder question has always had a different answer.


Leave a Reply
You must be logged in to post a comment.