
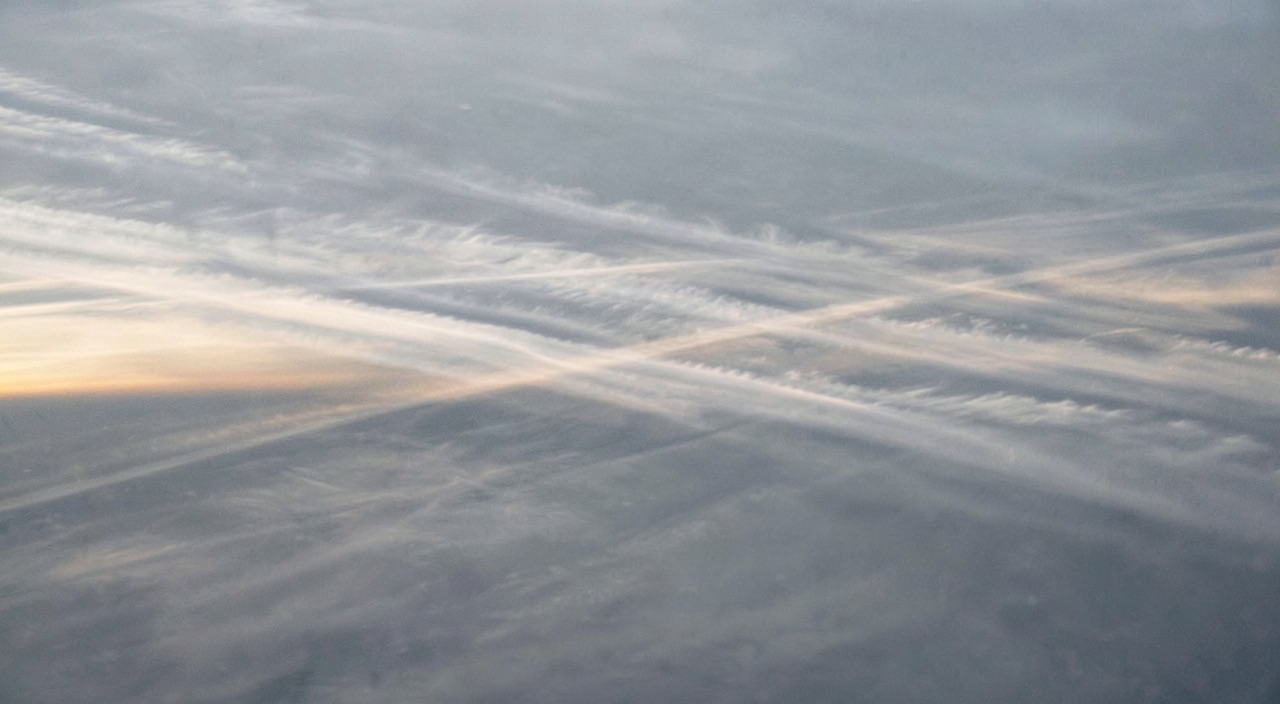
Turbulence is common for two aircraft separated by 2,000 feet on the same route to report different conditions: one may report moderate turbulence lasting, while the other mentions nothing. Nothing on the significant weather chart distinguished their levels, yet the mechanism was readable before takeoff. What shakes the aircraft is not the strong wind: it’s how it changes over a few hundred feet, and the position chosen within the jet stream.
What breaks is not the wind, but its relationship to stability.
A wind of 200 knots does not shake the aircraft as long as it is steady: the aircraft flies within the airmass, not against it, and a strong but uniform wind is reflected in ground speed, not on accelerometers. What produces clear-air turbulence is the disruption of a balance between two factors competing for the same layer: static stability, which returns a vertically displaced particle to its original level, and vertical wind shear, which provides the energy to move it away.
The ratio of these two factors has a name, the Richardson number: stability in the numerator, the square of vertical shear in the denominator. As long as it remains high, the flow slides in layers, each retaining its identity. When it drops below a threshold of about a quarter, the layers can no longer slide over each other without rolling: the interface wrinkles, the folds tip, and Kelvin-Helmholtz instability develops. The resulting rollers initially measure a few hundred meters; as they break, they transfer energy to increasingly smaller vortices.
This cascade explains what the crew feels. An aircraft does not react to all vortices; it filters them. Very large vortices carry the aircraft as a slow, barely perceptible undulation in the cabin; very small ones produce only noise. What truly moves the airframe are vortices whose size is comparable to the distance traveled during the aircraft’s response time, typically a few tens to hundreds of meters. Clear-air turbulence is therefore inherently intermittent: it exists in packets that form, break, and dissipate, explaining why a layer may shake for two minutes, then calm, then resume, without any boundary being crossed.
And it is invisible. The process requires no condensation; without droplets or crystals, the weather radar has nothing to illuminate, and the eye has nothing to see. Occasionally, a sufficiently humid layer may form regular bands—these roll clouds that betray the rolling motion—but this is the exception. The rule is a clear sky, which is what distinguishes this phenomenon from all other cruise hazards.
Clear-air turbulence happens when wind changes too much over short distances (shear) and the air isn’t stable enough to resist it. Think of it like waves forming when wind blows over water – but in the sky, with invisible “waves” shaking the plane.
An Airbus A320 flying at FL350 (35,000ft) reports moderate turbulence while another A320 just 2,000ft below reports smooth conditions. The jet stream shows 180kt winds at FL350 and 160kt at FL330 – a 20kt shear over 2,000ft (10kt per 1,000ft). The Richardson number drops below 0.25 in this layer, creating turbulence for the higher aircraft but not the lower one.
Where the shear hides in the jet stream.
The jet stream is not a pipe; it is the result of a temperature contrast maintained over a large depth. The thermal wind relationship states it simply—where a horizontal temperature gradient exists, the wind changes with altitude, and the faster the gradient, the stronger the change. The wind increases as long as the contrast persists, reaches its maximum where the contrast vanishes, near the tropopause, then decreases above, as the gradient reverses in the stratosphere.
This mechanism places the maximum vertical shear just below and just above the core, never inside. The horizontal shear, meanwhile, is most pronounced on the cold side, toward higher latitudes, where the isotachs tighten. This is also where the tropopause may sag, sometimes folding downward along the frontal zone: stratospheric air, very stable, then descends into the troposphere and is superimposed over much less stable layers. Stability is strong, but shear is stronger, and it is the ratio that matters.
The operational consequence is simple: the cold side and the layer immediately below the core are, by far, the most productive. A flight skirting the jet on the warm side, well below the core, crosses a region where shear has already weakened; the same flight on the cold side, at an equal distance from the axis, encounters a different atmosphere. Changing sides is not a comfort nuance; it is a change in mechanism.
Curvature does what shear alone cannot explain.
A chart may show modest shear, yet the flight proves rough. What is missing from the analysis is geometry. In a strongly curved segment—a trough, the entry or exit of a wind maximum—the flow is no longer in equilibrium: particles accelerate entering the maximum and decelerate exiting, and this acceleration along the axis generates a transverse circulation that tilts or rolls the isentropic surfaces. Local shear is thereby enhanced, sometimes where the isotach chart alone suggested nothing.
Three situations warrant attention during flight planning, regardless of wind speed. The bottom of a pronounced trough, where cyclonic curvature is strongest. The exit of a wind maximum, on the high-latitude side, where transverse circulation destabilizes the layer below the core. And zones where two branches converge or diverge, with confluence tightening isotachs over a short distance. To these three cases, add an external source: a wave generated by a mountain range can propagate to cruise levels and break upon encountering the shear layer far downstream of the terrain that produced it—explaining seemingly causeless encounters in an otherwise smooth flow.
What must therefore be sought on an altitude wind chart is not the highest value, but where something changes rapidly: the tightening of isotachs, a bend in the axis, the end of a maximum. A very strong wind, if steady and straight, is often the calmest segment of the route.
Translating a wind chart into shear.
Useful reading occurs at two levels, not one. On altitude wind and temperature forecasts, the wind vector is noted at significant points along the route for the requested level and the adjacent level, at the same validity time. The difference between the two vectors, divided by the altitude difference, yields the vertical shear. The term « vector » is essential: a 30-degree rotation at constant speed is as real a shear as a 30-knot speed difference at constant direction, and this is the most often missed case because the two speed figures resemble and reassure.
Order-of-magnitude values have long circulated in aeronautical meteorology manuals: a few knots per thousand feet vertically, a few tens of knots per hundred nautical miles horizontally, indicate a layer worth examining. The retained values vary from manual to manual, which says enough about what they are: sorting benchmarks, not thresholds. They say nothing about stability, hence nothing about the decisive ratio. They serve to flag segments to monitor, not to predict intensity.
The temperature field complements the reading, and it is re-examined in flight. The deviation from standard atmosphere, and especially its evolution along the route, positions the aircraft relative to the core: the thermal contrast that creates the jet does not vanish, and its trace is read on the probe. A marked cooling accompanied by an increase in the crosswind component does not mean the same as a warming accompanied by a decrease, and this difference indicates which side of the axis is being flown.
Remain the automated products. Turbulence indices from models do not calculate turbulence: they diagnose shear, deformation, and curvature at the model grid scale, then combine them into a probability of encounter. The phenomenon, however, lives at scales the grid cannot resolve. A clean chart is therefore not a guarantee, a charged field is not a certainty, and two providers may differ on the same jet without either being wrong. These products rank a route; they do not describe a layer.
The trap: a report of bumps is perishable and moves. A turbulent layer is advected by the flow that produced it, meaning at the jet’s own speed. A half-hour-old report no longer indicates the point where it was issued but a point far downstream, and nothing says the packet survived the journey. Preparing to find turbulence at the reported point, then considering it passed once that point is crossed, leads to securing the cabin too late and releasing it too early. A report is valuable as an indication of mechanism and level, much less as a geographic position.
Four possible responses, and what each costs.
Clear-air turbulence layers are flat. Their thickness is typically measured in hundreds of feet, sometimes a thousand or two, while their length is measured in tens or even hundreds of nautical miles, and their width in tens. This anisotropy dictates strategy: a level change crosses the small dimension, a heading change traverses the large. This is why waiting for it to pass is almost always the least effective option, and why one or two levels often suffice where a hundred nautical miles do not.
The direction of change matters as much as its magnitude. Descending toward the core, when already below it, means entering the layer of maximum shear; climbing above the core, when mass and buffer margin allow, exits the zone from above and finds much more stable air. The wind reported on board at the two adjacent levels settles this question better than any general rule, and it is obtained in seconds on the flight management computer.
| Action | What it changes physically | When it is the right choice | What it costs | The associated trap |
|---|---|---|---|---|
| Climb one or two levels | Crosses the thin dimension of the layer upwards and finds, above the core, much more stable air | When the wind decreases or veers little at the higher level, and the mass leaves buffet margin | Reduced buffet margin, optimum level reached earlier than planned | Taking a level for comfort while the mass is still high |
| Descend one or two levels | Crosses the layer downwards, but brings you closer to the layer of maximum shear if already below the core | When above the core, or when the lower level has already been reported smooth by an aircraft in the same stream | Degraded specific range, of the order of a few per cent per level | Descending by reflex without having located the core, and entering the worst of the shear |
| Lateral offset towards the warm flank | Changes sides of the axis, and therefore the horizontal shear and stability regime, without changing level | Narrow jet, route roughly parallel to the axis, airspace where an offset can be agreed quickly | A few nautical miles of distance and coordination with ATC | Offsetting to the wrong side through failing to read temperature and crosswind |
| Hold turbulence penetration speed | Reduces gust load and widens handling tolerance, without leaving the layer | When no change of flight path is available, or while awaiting a clearance | Range, and sometimes the need to leave the current level at high mass | Mistaking it for a comfort measure and holding it long after leaving the layer |
Lateral offset is the least often requested option and the best suited to precise geometry: a narrow jet, a route substantially parallel to the axis, and space to negotiate the offset without lengthy discussion. A few tens of nautical miles toward the warm side sometimes changes more than a level, for negligible distance cost. One must know which side of the axis is being flown, which brings us back to the joint reading of wind and temperature.
The right reflex: request the level before needing it. A layer rarely signals itself with a gradual degradation; it begins. The level that solves the problem is occupied in the following minutes because all crews in the same flow request it at the same time. Identifying the segment during flight planning, announcing the request to ATC before arrival, and specifying an acceptable fallback level costs one phrase and preserves the only thing that cannot be recovered: the choice.
The comfortable level comes at a cost to other factors.
A level change requested for comfort affects performance. Upward, the buffer margin narrows: at high mass and high level, the gap between the low-speed buffer and the compressibility buffer shrinks, and this is precisely where the margin is stressed by turbulence-induced variations in angle of attack and load factor. An additional level taken too early in the flight, before mass has sufficiently decreased, turns a comfort decision into a margin reduction.
Downward, it is fuel consumption that pays. Flying well below the optimal level degrades specific range, by a few percent per 2,000-foot slice depending on type and mass, and the penalty accumulates over the segment’s duration. On a long leg, a level abandoned for an hour is not comparable to a level abandoned for the rest of the flight: the decision is not the same, and announcing it as temporary to ATC changes what can be resumed later.
The turbulence penetration speed, finally, is not a comfort setting. It is an approved compromise between the gust load the structure must withstand and the margins available on both sides of the flight envelope. Maintaining it reduces loads and makes flying more forgiving; it costs range and, at high altitude and mass, may not be compatible with the occupied level. This is another reason for the level decision to be made before turbulence sets in, not during.
Finally, the reported intensity is not a property of the air alone. At identical gusts, the response depends on wing loading, mass, speed, and wing flexibility: two dissimilar aircraft crossing the same layer will report different conditions in good faith, and the lighter one will report the most. This justifies the gradual shift to an objective measure, the turbulence dissipation rate, calculated on board and designed to no longer depend on aircraft type. Until it is universal, cross-referencing reports from dissimilar aircraft remains an approximation that must be acknowledged as such.
What to verify in-house, and what remains uncertain.
Three points are verified in one’s own documentation rather than in an article. First, the penetration speed: a single value, a table by mass and level, or a range—the wording changes what is possible when already shaken. Next, cabin securing: who decides, the delay the purser may request, and what is planned when a service is underway in an aisle with a cart engaged. Finally, the turbulence product actually used by the flight planning service, its grid, and its validity time, otherwise one interprets a field without knowing what it represents.
The gray area will not close anytime soon. Models diagnose the cause, not the effect; clear-air turbulence remains the only cruise hazard that neither onboard radar nor the eye detects, and the only one for which remote detection still relies on non-generalized work. In the meantime, anticipation is the only available margin, and it is built during flight planning, not when the first gust is felt.
For those preparing for a type rating or line check, the consequence is direct: what is observed is not the ability to avoid—no one avoids what they cannot see—but the ability to justify a level request, to make it early enough, and to secure the cabin before the decision becomes impossible. It is an exercise in preparation and communication as much as in flying, and it is practiced as such, in dedicated preparation or by confronting real cases with other crews on the professional forum.
The applicable regulations, the operator’s approved operations manual, and the manufacturer’s approved documentation take precedence over anything written here; in case of discrepancy, they are authoritative.


Leave a Reply
You must be logged in to post a comment.