
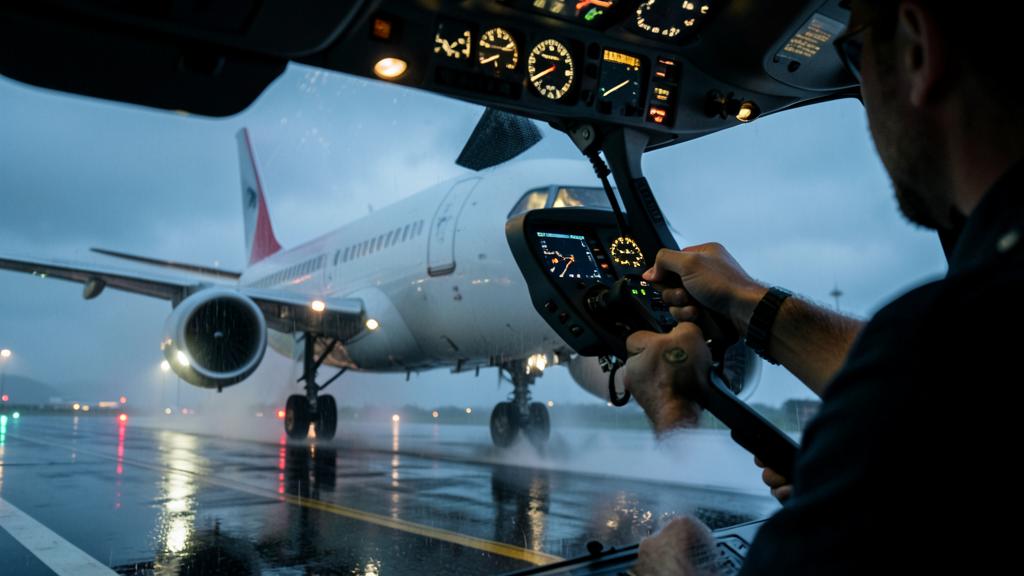
Wind 280° at 24 knots, gusting 34, runway 34 in use: the 90° component exceeds 20 knots steady and approaches 30 in the gusts. The flight manual gives a comfortable demonstrated value, the operations manual a lower value, and the runway has just turned wet. Three figures, three different natures, and only one applies that day.
Three figures, three natures
The demonstrated component is a test result, not a calculation. Certification specifications require establishing, for a dry runway, a 90° crosswind component demonstrated as safe for takeoff and landing. The text sets a floor – around 20 knots, noted when the reference speed on landing is high – and exempts the manufacturer from exceeding a modest ceiling. A low figure does not indicate a bad aircraft: it often signals a test campaign that did not encounter more wind.
This value only becomes a limitation if the approved flight manual includes it in the limitations chapter. Many types place it in the normal procedures instead, with an explicit note to that effect. Other crosswind limits are real: those governing automatic landings or degraded configurations are non-negotiable.
Between the two lies the operational limit. Applicable to crews, it can be lower than the demonstrated value and is almost always adjusted for: runway condition, gusts included or not, runway width, copilot experience. It is this figure, and this figure alone, that is compared with the day’s component.
| Figure | What it measures | Who establishes it | What makes it vary | Applicable |
|---|---|---|---|---|
| Demonstrated component | The wind encountered and judged manageable during flight tests | The manufacturer, under authority oversight | The weather on test days and the required ceiling | No, unless listed as a limitation |
| Flight manual limit | An approved boundary, often linked to a system | The manufacturer, approved by the authority | Configuration, guidance mode, system status | Yes, without exception |
| Operational limit | The margin that the operator authorizes | The operator, in its manual | Runway condition, gusts, width, experience, terrain | Yes, for its crews |
| Day’s component | What the aircraft can handle on landing | Meteorology, chosen runway, wind source | Reported direction and speed, gusts, local effects | It alone must stay below the previous ones |
What the demonstration measured, and what it omitted
The acceptance criterion is not that the aircraft landed, but that it did so “without requiring exceptional skill, alertness or strength.” This judgment applies to a conforming aircraft with all systems normal, on a dry, wide and familiar runway, by a test pilot prepared for this specific exercise. Nothing misleading about that, but none of it resembles the end of a long duty.
What the figure does not include is quickly listed: tires near the end of their life, strong gusts, low-altitude wind shear, turbulence from buildings along the runway, a crew on their fourth night sector, a latent failure reducing available control deflection. All of this consumes the control margin without appearing in the displayed value.
Above all, this value is not structural: nothing breaks one knot above it. The lateral loads on the landing gear are covered by dedicated landing cases, independent of the crosswind demonstration. Exceeding it causes no structural failure, but a progressive loss of lateral control.
The crosswind limit is not about breaking the plane but about how well the crew can control it. It’s based on tests in ideal conditions, so real-world factors like gusts or wet runways can make it harder to stay in control.
An Airbus A320 has a demonstrated crosswind limit of 30 knots, but the operator’s manual may reduce this to 25 knots for a wet runway. On a day with 28-knot gusts, the crew must decide whether to land, knowing that gusts could push them beyond the operational limit.
The real ceiling is lateral control
Control authority sets the tolerable sideslip
As long as the aircraft is flying, there is only one way to track the runway centerline without drift: sideslip. The required angle is the arctangent of the ratio between the crosswind component and the airspeed. It increases almost proportionally to the wind in the useful range, and even more when the approach speed is low: a light aircraft, full flaps, needs a significantly higher angle in the same wind than a heavy aircraft.
Holding this sideslip costs rudder, which opposes the yaw moment produced by directional stability. The limit is reached for a given angle, and the corresponding component follows the speed: an increase in approach speed in strong wind is not a comfort margin, it restores control authority.
Roll is the first to run out
Sideslip does not only cost rudder. On a swept wing, it produces a significant rolling moment, to which is added that induced by the rudder. The combination is countered by the ailerons and spoilers, whose effectiveness collapses at low speed and in ground effect. The remaining roll margin is the only resource to absorb a gust during the flare: it is this, and not the rudder, that runs out first.
Finally, geometry comes into play. The clearance under the nacelle and under the wing tip, in landing attitude with the gear compressed, is measured in a few degrees. Hence the universal compromise of the strong crosswind landing: a residual sideslip rather than a low wing out of limits, paid in lateral load on the landing gear.
The last minute: decrab, touchdown, rollout
Three ways of arriving coexist: sideslip established on final, crab held until the flare then removed with rudder, or a combination of the two. None is superior in absolute terms: the first exposes for a long time and consumes the margin in gusts, the second concentrates the difficulty over two seconds, the third requires finesse.
Chronology counts as much as technique. At the moment the rudder aligns the nose with the centerline, the input creates a rolling moment that must be countered with aileron, and the aircraft, now in sideslip, drifts downwind. Hence the need for a late and brief decrab, and the explicit acceptance of a residual sideslip on landing when the runway is not dry.
After touchdown, the resource changes nature: it becomes tire friction. The rudder remains effective as long as the speed is high, then gives way to nose wheel steering and differential braking. The aileron, for its part, is moved progressively to the into-wind stop as speed decreases, to prevent the wind from lifting the upwind wing and unloading the landing gear on that side. This input costs nothing, and it is the first to be relaxed when workload increases.
The right reflex. Think in terms of control margin rather than numbers: in the last few hundred feet, note the deflection already necessary to stay on the centerline. If you approach the stop before the flare, the written limit has become theoretical. During the rollout on a slippery runway, if the drift sets in despite the correction, reduce the reverse thrust, regain the centerline, then reapply.
Why the figure collapses as soon as the runway is no longer dry
During rollout, the aircraft holds the centerline through the lateral force of the tires, limited by the available friction. This friction is shared: what braking consumes in longitudinal force is no longer available for lateral guidance. Aggressive autobraking on a degraded runway therefore removes, at the worst moment, the directional control capability that would be needed: this is anticipated when selecting the braking level.
Add the weathercock effect: the fin, well aft of the main gear, tends to bring the nose back into the wind. On a dry runway, the tires oppose this without difficulty; on a snow-covered or icy runway, they no longer have the means to do so. The result is not a sudden exit, but a slow rotation towards the edge, very difficult to recover.
That is why the crosswind limit tables are indexed to runway condition, or to the standardized runway condition code. The decrease is progressive between dry and wet, then abrupt as soon as reported braking action becomes poor: a reflection of the lateral adhesion curve, not an administrative caution.
The trap. Does the limit apply to the average wind or to the gust, and according to which source? A routine weather report gives a direction referenced to true north and a long averaging period; the tower gives a magnetic direction, a short average and the instantaneous variation. With a significant declination, the component calculated from the message differs from that deduced from the tower’s announcement, and the same landing passes above or below the limit depending on which figure is used.
What the operator writes, what the captain does
The chain is simple: the flight manual provides an envelope and possible limitations, the operations manual derives a value and its reductions, the captain applies the most restrictive and can always make it more restrictive, never less. What is prepared on the ground is therefore not the figure, but its status.
Two areas deserve attention. The first concerns systems: automatic landing is certified within a wind envelope often well below the demonstrated value in manual flight. It is no longer the crew’s ability that is at stake, but the validated envelope of a computer.
The other trap. This automatic landing limit is an approved limitation, not an indicative value, and it applies as soon as the automation flies the approach, even if a manual takeover is planned before touchdown. It is verified on the prepared approach, with the applicable minimum.
The second area is training. The simulator reproduces an aerodynamic model fed by tests; at high sideslips near the ground, this model is extrapolated and the rendered movement remains a convention. A crew that has only known strong crosswinds in the simulator has seen the chronology, not the forces on the controls or the chopped turbulence of a runway bordered by hangars. This indicates where to place the margin, and justifies why many operators lower the limit for a first officer in line training. The type rating training courses address the subject through the status of the values rather than the figure.
The crosswind figure is never read alone. A landing procedure after flight in icing conditions requires a speed increment: it reduces the required sideslip, but lengthens the landing distance on an already degraded runway. The limitations combine, and it is the most restrictive one that decides.
What to look for in your documentation
The useful work is not to memorize a figure, but to answer these questions without opening the manual during the descent:
- Does the flight manual value appear in the limitations chapter, or in normal procedures with a note stating otherwise?
- Does the operational limit include gusts, and according to which wind source?
- Is there a separate value for takeoff, linked to directional control after engine failure?
- What reductions apply: runway condition, automatic landing, low visibility, narrow runway, first officer in line training, combined tailwind?
- Does the calculation method used by the operator use the magnetic direction, and does the onboard tool use the same reference?
| Phase | Quantity that saturates | Precursor sign | What reduces the margin |
|---|---|---|---|
| Stabilized final | Rudder authority | Rudder near the stop to hold the centerline | Low approach speed, wind shear, low mass |
| Float and decrab | Roll margin and geometric clearance | Increasing bank without the drift stopping | Ground effect, gusts, ineffective spoilers |
| Wheel touch | Allowable lateral load on the landing gear | Visible residual drift, immediate swerve | Incomplete or too early decrab, long touchdown |
| Fast rollout | Opposition to the weathercock effect | Rudder correction that no longer suffices | Reverse thrust, slippery runway, upwind wing lifted |
| Slow rollout | Lateral tire friction | Nose wheel skidding despite steering | Heavy braking, contamination, aileron released |
There remains a gray area that nothing will fill. The announced wind is that of an anemometer installed about ten meters above the ground, averaged; the wind in the flare is instantaneous, taken at variable height, behind a line of trees or a hangar. The difference cannot be calculated: it is managed by the retained margin and by the willingness to perform a go-around without treating it as an admission of failure, a recurring subject of the professional forum.
For those preparing a type rating, the question asked rarely concerns the figure: it concerns its status. Knowing how to explain why the demonstrated value is not a limit, why the automatic landing value is one, and by what mechanism the runway condition redefines everything, is better than reciting three figures.
The applicable text, the approved flight manual of the aircraft, and the approved operations documentation prevail in all circumstances over this article, which explains a mechanism and does not replace any limitation.


Leave a Reply
You must be logged in to post a comment.