
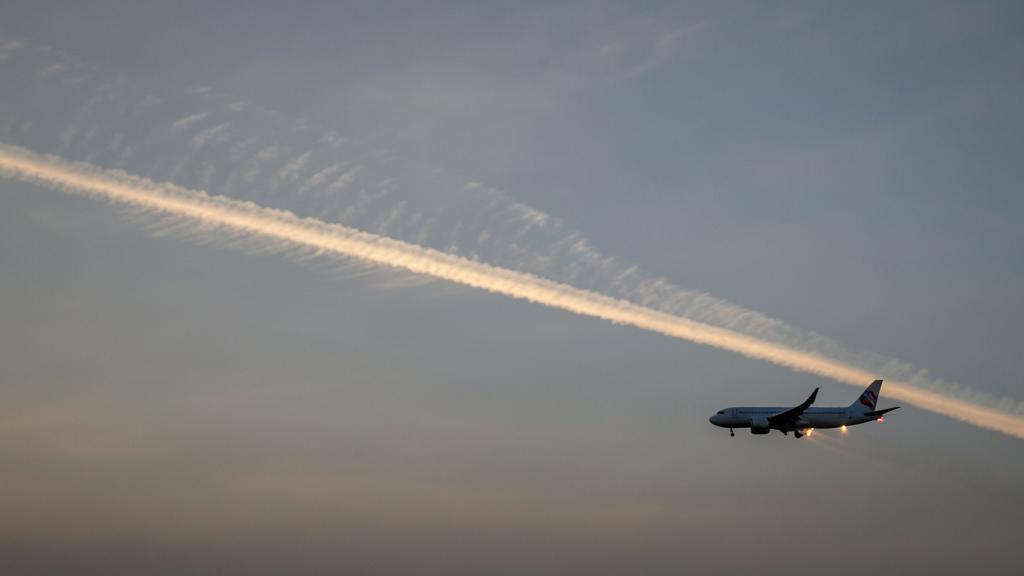
The day’s file adds another layer: a « persistent contrail risk » band between two reporting points, and a proposal to descend one level for forty minutes. The fuel cost overrun is announced to the nearest hundred kilograms. No one can say what the maneuver avoids—or even if it avoids anything. This gap between a measurable cost and a modeled benefit is the whole issue.
Two distinct conditions, regularly confused
A contrail does not appear because the air is humid, but because the mixture of the hot, saturated turbine jet and the ambient air briefly reaches saturation relative to liquid water. This is the Schmidt-Appleman criterion: in the temperature-vapor pressure plane, the mixture follows a straight line whose slope depends only on ambient pressure, water produced per unit of energy burned, and the fraction of that energy exiting as thrust rather than heat.
This last term is surprising. The more efficient the engine, the less hot the plume is for the same water load, the steeper the line, and the higher the formation threshold. An engine that consumes less forms contrails where an older-generation engine would not: the two subjects are not treated separately.
Formation says nothing about duration. Crystals only survive if the ambient air is supersaturated with respect to ice; otherwise, they sublimate in seconds to minutes, and the contrail has no radiative consequence. Persistence is the climatic concern, and it is the hardest to predict. The temperature threshold is around forty degrees below zero at cruising levels.
Contrails form when hot engine exhaust mixes with cold air in a specific way. But whether they last depends on whether the air is extra-cold and humid (supersaturated). These are two different things: formation is easier to predict than persistence.
An Airbus A320 flying at 35,000 feet (-40°C) with a modern efficient engine might not form contrails in slightly warmer air, while an older Boeing 737 with less efficient engines would. But if both cross a supersaturated layer at -50°C, their contrails could persist for hours, becoming indistinguishable from natural cirrus clouds.
The forcing is in the cirrus, not in the contrail
A persistent contrail does not remain a line: shear stretches it, sedimentation gives it thickness, and after a few dozen minutes it is indistinguishable from natural cirrus. This is the object that carries the radiative effect.
The balance has two terms of opposite signs. Cirrus intercepts outgoing infrared and re-emits it downward: warming. It reflects a fraction of incoming solar: cooling. At night, the second term is zero: the sign is unambiguous. During the day, it depends on the sun’s height and what lies below—over a dark ocean, the added reflection is strong; over a thick cloud layer or snow cover, the surface already reflected most, and infrared dominates.
Remains the comparison with carbon dioxide. A cirrus lasts hours, a ton of carbon centuries; equating them requires a metric, and this choice is not neutral. Instantaneous, it places contrails in the same order of magnitude as aviation’s accumulated carbon; integrated over a century, it strongly reduces their relative weight. The most cited assessments attach a low confidence level to their figures.
Contrails that last become cirrus clouds. These clouds can either warm the planet (by trapping heat) or cool it (by reflecting sunlight). Which effect wins depends on the time of day and what’s below the cloud. But compared to CO2, which lasts centuries, contrails’ climate impact is much shorter.
A Boeing 787 flying at 37,000 feet over the North Atlantic at midnight in winter creates a contrail that persists. This contrail acts like a thin cirrus cloud, trapping outgoing infrared radiation and warming the atmosphere. The warming effect is strongest at night when there’s no sunlight to offset it with cooling reflection.
Why the supersaturated zone is poorly predicted
Measurement. The humidity sensor of operational radiosondes loses sensitivity and response time at cirrus temperatures; the dry bias is documented, statistically corrected, and persists. The network is terrestrial, sparse, limited to a few daily launches, and nearly absent over oceans where major traffic flows. Satellite sounders, meanwhile, integrate humidity over thick layers, lacking the vertical resolution that matters here.
Cloud scheme. A model that condenses at ice saturation cannot, by design, represent a supersaturated zone: the sought quantity is eliminated by the model’s physics. Several centers now allow it in clear skies, but this field remains one of the least observationally constrained.
Geometry. A supersaturated zone is a lens: typically a few hundred meters thick, often less than the thousand feet separating adjacent levels, for tens to hundreds of kilometers of horizontal extent. The error rarely concerns the layer’s existence, almost always its position: one level lower, a few dozen kilometers away, a few hours later.
Quality degrades further with time: what is decided at dispatch, hours before passage, does not rely on the same information as a decision made one hour before. The gap between strategic planning and tactical adjustment is one of two reliability regimes.
We can’t measure humidity in the upper atmosphere very well. The tools we have (weather balloons and satellites) either don’t go high enough or don’t give us fine enough details. Weather models also struggle to predict these thin, supersaturated layers because they’re so small and short-lived. By the time we make a decision to avoid them, the information might be hours old and less reliable.
An Airbus A350 is planned to fly at 37,000 feet over the North Atlantic. The weather model predicts a supersaturated layer at 36,000 feet, 50 km ahead. The crew decides to climb to 38,000 feet to avoid it. But in reality, the layer was actually at 37,000 feet and 30 km ahead – the aircraft flew right through it, creating a persistent contrail. The model was only off by one flight level and a short distance, but that was enough to make the avoidance ineffective.
Certain fuel against probable benefit
The cost, however, is calculated. Leaving the optimal level degrades specific range, and detouring lengthens the route; in both cases, the surplus is recorded in flight data, declared, and becomes undeniable emissions.
The benefit is a product of probabilities: that the layer is where it is forecast, that the aircraft would have crossed it, that the contrail would have persisted, that it would have warmed rather than cooled, and that the replacement trajectory would not encounter another. Five factors below unity yield a modest result, whose uncertainty spans zero.
Hence, indispensable targeting rather than desirable. Modeling work converges: forcing is concentrated on a small fraction of flights—a few percent, depending on trajectory sets—those crossing a thick layer at night, where traffic axes intersect supersaturation axes. On this fraction, imperfect avoidance remains beneficial; applied indiscriminately, the overcost is paid across the fleet while the benefit remains concentrated, and the balance tips.
| Decision | Supersaturated layer actually crossed | Air actually subsaturated |
|---|---|---|
| Deviation flown | Contrail avoided. Real benefit, quantifiable only by a model. Extra cost paid. | Extra cost paid for nothing. Certain additional emissions, zero benefit. |
| Deviation not flown | Contrail formed. Forcing incurred, but no fuel wasted and no constraint on ATC. | Nominal situation, and the most frequent case. |
The trap of the « climb to go above » maneuver. Exiting from above leads to colder air, thus more favorable to formation. If the initial level was marginally too warm for the criterion to be met, the climb may create the contrail it claimed to avoid, with fuel expended in both cases. Descent warms, so it is more robust—and almost always the most costly.
What avoidance costs the system
A level change is not a flight decision, it is a request to ATC, and the cruise level assignment table already constrains the choice by heading. In a busy sector, a non-optimal level requested by multiple flights for the same meteorological reason—the layer is extensive and everyone receives the same field—produces what traffic management seeks to avoid: a correlated demand, in the same place, at the same time, where organized oceanic routes leave the least margin.
Fuel follows the same logic. Planned, the deviation appears in the operational flight plan and its fuel is calculated as such. Decided in flight, it draws from what remains—and what remains has a purpose: en route fuel, en route reserve, final reserve, and diversion fuel are not interchangeable. No environmental objective makes them available, and the captain’s authority is not amended by a display layer.
Three questions before accepting a non-optimal level. What the displayed layer represents—probability of persistence or estimated forcing, it is not the same; the forecast’s time horizon and vertical resolution that feeds it; where the maneuver’s fuel comes from. A « contrail risk » layer is not a « warming » layer: during the day, over a dark sea, the sign may reverse.
The lever that does not require deviation
The number of crystals formed in the plume is set by the number of available nuclei, and at these altitudes, these are mostly soot particles from combustion. Less soot means fewer crystals, thus larger crystals for the same water mass, faster sedimentation, lower optical thickness, and shorter lifetime. The relationship is steep at low concentrations: a reduction achieved on already clean fuel yields more than proportional returns.
The controllable parameter is the aromatic content of jet fuel, which governs most of the soot production. Low-aromatic blends reduce the number of non-volatile particles emitted—the nvPM of engine emission standards—and instrumented aircraft campaigns have shown the resulting reduction in crystals. It is also the most verifiable lever: this number is certified on the test bench according to a standardized method; it does not come from a model.
Hydrogen shifts the problem rather than eliminating it: no soot, but significantly more water per unit of energy. Contrails would form on ambient particles, fewer in number, with larger and likely less persistent crystals; but the formation threshold, itself, rises in temperature.
| Levier | Time to effect | Fuel cost | Uncertainty about the benefit | Decision-maker |
|---|---|---|---|---|
| Tactical avoidance in flight | Immediate | High and certain | High, short-range forecast | Crew and ATC |
| Level choice in the flight plan | At dispatch | Moderate, budgeted | Very high, long range | Flight planning |
| Low-aromatic fuel | At refuelling | None in flight | Low, measured on the test bed | Operator and supply chain |
| Combustion chamber design | One engine generation | None, or even negative | Low on particles, open on cirrus | Manufacturer and certification |
One side of the balance measured, the other modeled
Young contrails can be detected from a geostationary satellite: the brightness temperature difference between two adjacent infrared channels reveals thin ice clouds, and the object is linear, thus recognizable. Detection fades precisely when the object matters, when it widens and loses its linear shape.
Attribution to a flight is a second obstacle: advection must be replayed to link an image segment to a trajectory, and on a busy corridor, several flights are candidates. Above all, the sought quantity is the difference from an unflown trajectory: the counterfactual is not observable, it is calculated by the model whose humidity forecast is precisely in question. When the declaration of non-CO2 effects is implemented, the loop is worth noting: fuel mass will be declared with certainty, the rest estimated, and an incentive system based on this estimate will first reward compliance with the model.
What to verify at home
In the flight preparation system. Look for the vertical resolution of the field behind the « contrails » layer, if your operator displays one. A coarse grid does not distinguish between adjacent levels, which is precisely the question. An operator unable to answer cannot base a decision on this display.
In the operations manual. Check if the fuel policy includes a provision for environmental maneuvers, or if the subject is absent. If it is, any in-flight deviation will draw from something else, and it is better to establish this before the flight than to note it afterward.
In the safety management system. A deviation for climatic reasons is a trajectory modification like any other: it falls under hazard analysis on par with a thunderstorm detour, with its effects on workload, coordination, and fuel margin. Treating it outside the safety system remains the surest way to handle it poorly.
A gray area that no document closes remains: nothing obliges a crew to deviate, nothing prevents an operator from encouraging it through a performance indicator. Pressure will come from there, not from the rules of the air. For those preparing for a qualification or an operational position—the training paths are beginning to integrate the question—the discriminating point is not to cite a forcing value: it is to know that formation and persistence are two distinct conditions, and to say which one is poorly predicted.
What precedes describes mechanisms, not obligations. The applicable text, the air navigation service provider’s procedures, and the operator’s approved documentation take precedence over this article; in case of discrepancy, the on-board documentation is authoritative.


Leave a Reply
You must be logged in to post a comment.