
A connectivity antenna is sold to an airline roughly the way a roof box is sold to a driver: a unit price, a fitting time, and a promise about what it will carry. The airframe answers in a different currency. It answers in drag counts paid every airborne hour, in installed mass that never comes off again, in local reinforcement of the crown, in inspection tasks that join the maintenance programme for the life of the aircraft, and in a performance data change that has to reach the flight planning system or the fuel figures quietly stop being true. This is how to price all of that before the retrofit is signed, and where the revenue has to land for the arithmetic to close.
The antenna is the smallest part of the installation
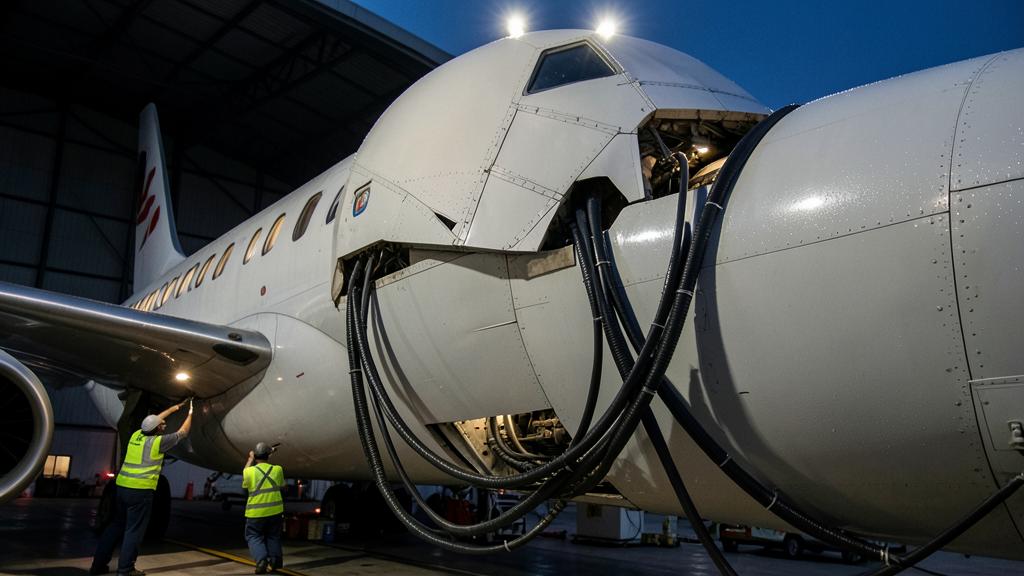
The visible object is a radome on the crown, a shallow fairing over an aperture. What goes on the weight and balance sheet is a system, and the system is mostly cable. A mechanically steered antenna brings a positioner and its drive electronics; an electronically steered array brings a flatter panel but a power conditioning unit and, on some installations, a cooling provision. Both bring a modem and a network manager in an equipment bay, power feeders from the distribution panel, coaxial or waveguide runs from the crown to the bay, wireless access points and their cabling through the cabin, a server if content is hosted on board, and the structural doublers and fasteners that hold the whole thing to a pressurised skin.
The surprise in most retrofit programmes is not the antenna mass. It is the cable and the reinforcement. A crown-to-bay run on a widebody is long, shielded, routed away from other systems for segregation reasons, and heavier per metre than any datasheet suggests. The doublers are heavier still, because a hole in a pressurised fuselage has to be given back more material than it removed.
| Line item | What drives the figure | Who owns the number |
|---|---|---|
| Antenna and radome | Aperture size, band, steering technology, gain required for the target coverage | Antenna supplier, fixed by the part number |
| Adapter plate, doublers, fasteners, sealant | Skin gauge, frame and stringer pitch at the chosen station, cut-out size | The design organisation holding the modification approval |
| Positioner or power conditioning, modem, network manager | Architecture chosen, redundancy level, whether content is hosted on board | System supplier |
| Feeders, coaxial or waveguide runs, brackets and clamps | Distance from crown to equipment bay, segregation and shielding rules | The installer, and only after the routing study is done |
| Cabin distribution: access points, cabling, in-seat provisions | Cabin length, cabin layout, number of zones, existing cabin network | The installer |
| Cooling and thermal provisions | Equipment dissipation, bay temperature, altitude derating | System supplier plus the design organisation |
The antenna itself is just the tip of the iceberg. The real weight comes from cables, reinforcement, and other hidden components. A small hole in the fuselage requires heavy structural reinforcement to maintain safety, and all these extra parts add up to a lot of extra weight and complexity.
On a Boeing 777, installing a satcom antenna might add 150 kg for the antenna and radome, but the cables, reinforcement, and other components could add another 300 kg or more. The total installed mass can easily exceed 450 kg, far more than just the antenna itself.
Where the drag comes from, and why a bare number is useless
A radome on the crown adds drag through three mechanisms, and only the first is intuitive. There is the pressure drag of the fairing itself, which is what a shape study optimises. There is skin friction on the added wetted area, which is small. And there is interference drag, produced where the fairing sits inside a thick fuselage boundary layer and disturbs flow that then has to reattach. Interference is the term that punishes bad positioning: a fairing placed just ahead of another excrescence, or close to the fin root flow, can cost more than the same fairing placed cleanly.
The industry expresses the result as a drag count, one count being an increment of one ten-thousandth in the drag coefficient. That number is not a physical quantity on its own. A drag coefficient is a force divided by dynamic pressure and by a reference area, so a drag count only means something once you know which reference area it was normalised against and at which cruise condition it was derived. A supplier who quotes « under three counts » without stating the reference area and the Mach and altitude has quoted nothing. The same physical fairing on the same fuselage is a different count number depending on whether the normalisation used the wing reference area of a narrowbody or of a widebody.
Ask for the derivation, not the headline. Demand the increment in drag counts with the reference area, the Mach number and the altitude used, plus the method: computational study, wind tunnel, or measured in flight test against a clean airframe. Ask specifically whether the figure is for your airframe with your existing external fittings, or for a clean reference aircraft. Retrofit fleets rarely have a clean crown.
From drag counts to tonnes
The conversion is elementary and almost never done in the meeting where the decision is taken. Additional drag in cruise is dynamic pressure multiplied by the reference area multiplied by the coefficient increment. Additional thrust equals additional drag in level flight. Additional fuel flow is that thrust multiplied by the cruise thrust-specific fuel consumption. Annual fuel is that flow multiplied by airborne hours. Two worked chains, from stated assumptions, show the order of magnitude.
| Step | Short-haul example | Long-haul example |
|---|---|---|
| Assumed cruise | Mach 0.78, FL370 | Mach 0.85, FL350 |
| Assumed reference area | 120 square metres | 380 square metres |
| Dynamic pressure at that condition | about 9 200 pascals | about 12 100 pascals |
| Added drag for one count | about 110 newtons, near 11 kilogrammes force | about 460 newtons, near 47 kilogrammes force |
| Assumed cruise specific fuel consumption, in kilogrammes of fuel per hour per kilogramme of thrust | 0.60 | 0.55 |
| Added fuel flow, one count | roughly 7 kilogrammes per hour | roughly 26 kilogrammes per hour |
| Assumed annual airborne hours | 3 000 | 4 000 |
| Annual fuel, one count, one aircraft | roughly 20 tonnes | roughly 100 tonnes |
These are worked examples from assumptions written on the table, not manufacturer data, and the point is the shape of the result rather than the digits. Redo the chain with your own reference area, your own typical cruise condition, your own specific fuel consumption from the performance manual and your own utilisation. What the arithmetic establishes is that the unit of account for a crown fairing is tens of tonnes of fuel per aircraft per year per drag count, and that the whole business case therefore turns on a number the operator usually accepts without evidence.
The cruise figure is the floor, not the total. The chain above prices level cruise only. Add the climb, where the same increment is paid at higher thrust settings, and add the cost of carrying the fuel that pays for the drag, which compounds on long sectors and is negligible on short ones. And on a sector flown close to its payload-range limit, the extra trip fuel is not paid in fuel but in payload left on the ground, a few times a year and invisibly to the fuel accounts.
The drag from a satcom antenna adds up to a lot of extra fuel over time. The exact amount depends on how much drag the antenna creates, how often the plane flies, and how efficient the engines are. The cost isn’t just in cruise—it’s also in climb and in the extra fuel needed to carry that extra weight.
On an Airbus A320 with a reference area of 120 m², one drag count at Mach 0.78 and FL370 adds about 20 tonnes of fuel per year. For a Boeing 777 with a larger reference area, the same drag count could add around 100 tonnes per year. These numbers show why drag counts matter so much in the long run.
The second fuel term nobody enters: electrical load
A satellite communications installation is not a passive fairing. The antenna, its drive or beam-forming electronics, the modem, the network manager and every cabin access point draw electrical power continuously in flight, and on some installations the draw rises with data demand. That power comes off the engine-driven generators, and shaft power extraction is paid in fuel exactly as thrust is. It is a smaller term than the drag term on most installations, but it is a real one, it is continuous, and it belongs in the same column.
The airframe performance manual normally gives the fuel penalty per unit of shaft power extracted and the supplier states the electrical load; multiplying the two is a five-minute exercise that is almost always skipped. There is a thermal tail as well, where equipment dissipating heat into a bay pulls on the cooling architecture, and that pull is again fuel.
The mass budget, and the mass equivalent of drag
Installed mass enters the operational empty mass and stays there. Two consequences follow that are handled badly. First, the mass has a moment: an installation on the crown sits well above the vertical reference and, depending on the station chosen, may sit meaningfully forward or aft of the centre of gravity. The approved modification data provides the mass and the moment or index change, and that data has to reach the mass and balance system, not just the technical records. An operator on a fleet weighing programme has to decide whether the change is applied by calculation or verified by reweighing.
Second, the value of a kilogramme is not constant across the network. On the majority of sectors, an aircraft departs below every structural and performance limit, and an extra hundred kilogrammes costs only the fuel to carry it. On the sectors that are actually limited, by regulated take-off mass on a short or hot runway, by landing mass, or by payload-range on a long thin route, the same hundred kilogrammes is payload that cannot be sold, and its cost is the yield on that payload, not the fuel burn. The honest way to price installed mass is therefore to sort the network into limited and unlimited sectors and price the two populations separately.
Airframe engineering has a convenient device for comparing the two penalties: the exchange rate between drag and mass, the number of kilogrammes of permanent mass whose fuel cost equals one drag count on a given aircraft and mission. Once that rate is known, the fairing and the wiring can be added in a single currency, and the whole installation can be quoted as one equivalent mass figure that the commercial side can actually compare against a revenue line.
The extra weight from a satcom installation affects the plane in two ways. First, it costs fuel to carry that weight. Second, on some flights, it might mean the plane can’t carry as much payload, which costs money in lost revenue. The best way to compare these costs is to convert drag into an equivalent weight, so you can see the total impact in one number.
On a Boeing 737, one drag count might cost the same as carrying an extra 50 kg of weight. If the satcom installation adds 3 drag counts, that’s like adding 150 kg of weight. But on a long, thin route where the plane is already at its payload limit, that 150 kg might mean leaving 150 kg of cargo or passengers behind, which costs far more than the fuel to carry it.
What the structure gives back
A cut-out in a pressurised fuselage crown is a structural event. The material removed has to be replaced with more material than was taken, because a doubler has to restore both static strength and the fatigue and damage tolerance behaviour of the skin around a new set of fastener holes. That is why the reinforcement outweighs the aperture. It is also why such an installation is normally classified as a major change: it touches primary structure, pressurisation integrity, lightning protection and, on the crown, the paths that carry a strike toward the empennage.
The lasting consequence is not the doubler. It is the instructions for continued airworthiness that come with the design approval. Those instructions typically contain recurring inspections around the reinforcement and the fasteners, sealing checks, and functional checks of the installation. Once the modification is embodied, those tasks are not advisory: they enter the operator’s approved maintenance programme, they consume hangar hours on every relevant check, and they are audited. An operator that priced the retrofit as an installation cost and never priced the recurring tasks has understated the programme for the remaining life of the airframe.
The performance data has to move, or the fuel plan lies
This is where a good technical programme most often fails commercially. The drag increment is real from the day the aircraft leaves the hangar, but the flight planning system keeps computing with the aeroplane it knew. If the increment is not entered, as a performance factor, a drag degradation term or a supplement to the approved performance data, then every flight plan produced for that airframe under-predicts trip fuel by exactly the amount of the modification.
Nothing dramatic happens. The shortfall is small on any single sector and is absorbed by contingency fuel, which exists to absorb exactly that kind of deviation. So the fleet runs with a systematic bias, the fuel monitoring programme records a degradation it attributes to airframe ageing, and the statistical basis for any reduced contingency scheme is contaminated. The fix is cheap: the modification is not complete until the performance factor is updated in the planning system and the step announced to fuel monitoring so it is not read as drift.
The revenue side, and the honest break-even
Set against all of that is a revenue expectation, and the expectation is usually written in the wrong column. Direct passenger revenue from connectivity is measurable but modest for most operators: it is the product of a take rate and a price, and both have to be measured on your own network rather than borrowed from an industry average, because a business network and a leisure network behave nothing alike.
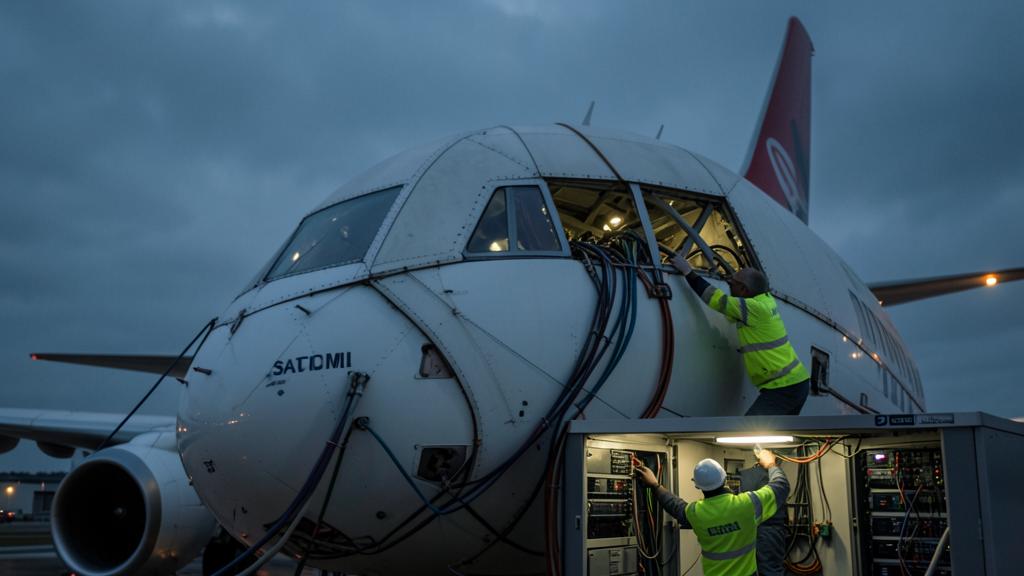
What frequently carries the case is the second column: the operational value of a permanently connected airframe. Real-time offload of engine and systems data lets a maintenance organisation prepare a rectification before the aircraft arrives, which converts unplanned ground time into planned ground time. Electronic flight bag connectivity in cruise means updated weather, updated notices and a live link to operations control, which is worth fuel on rerouting decisions. Crew and operations messaging shortens turnarounds and disruption recovery. None of that appears in an ancillary revenue report, which is exactly why it gets left out of the paper that authorises the spend.
| Annual cost, per aircraft | Annual value, per aircraft |
|---|
The summary a technical department should be able to give the commercial department in one sentence is this: the fairing is priced in tens of tonnes of fuel per aircraft per year for each drag count it adds, the wiring and reinforcement are priced in payload on the minority of sectors that are actually limited, the recurring inspections are priced for the remaining life of the airframe, and none of that is recoverable once the aperture is cut. The decision is defensible whenever the second column is honestly filled in, and it is indefensible whenever the first column contains only the invoice. Cabin retrofit and airframe performance topics are developed further in the engineering material at FL330 training.


Leave a Reply
You must be logged in to post a comment.