

A control surface position curve that descends, and the phrase comes naturally: « he pushed. » It’s not false, it’s not yet true: the recording establishes that a surface moved, not that a hand decided. Between the two stands an acquisition chain, a sampling step, two time bases to align, and an inference scale where each rung costs lost certainty.
A recorder logs a state, not an action.
The parameter you open is not the physical quantity you think you’re reading. It’s the present value, at the sampling instant, at a specific point on the aircraft: the output of a sensor, or a word circulating on a digital bus. Between the crew’s hand and this value, there is a mechanical linkage or a servo control, a position sensor, an acquisition unit that formats, a bus that transports, a protected memory that stores. Each stage leaves its signature: mechanical play, resolution, period, latency.
A control surface position measures the position of an organ, never the applied force: two opposing hands on the same axis can produce a near-zero position with maximum forces. A selected altitude is the value that a computer published on the bus; nothing in the frame distinguishes a selector rotation from a default value taken during a mode change. A discrete « autopilot disengaged » signal indicates a system state change, without specifying whether the origin is a button, a control force, a protection, or the loss of an input.
The first question of a serious reading is therefore not « what does the curve say, » but « what quantity, measured where, published by which equipment, and under what validity control. » The conversion document specific to the type and equipment version — the one that describes the frame, sources, ranges, periods — belongs to the evidence as much as the extracted file.
The recorder doesn’t capture human actions directly—it records mechanical states. A surface moving doesn’t prove a pilot pushed, and a stable reading might just mean the sensor stopped working. Always check the source and context before assuming intent.
On an Airbus A320, if the flight data recorder shows the elevator position moving down, it doesn’t prove the pilot pushed the control column. The elevator could have moved due to autopilot, trim, or even wind gusts. Without additional data (like control column force sensors, which aren’t always recorded), you can’t be sure.
The sampling rate decides what will remain visible.
A recorder does not follow a signal: it samples it at regular intervals. The rate depends on the parameter — several points per second for accelerations and control positions, one point every few seconds for slow quantities like fuel quantity. What happens between two points exists nowhere. The line connecting two samples is a plotting convention, not a measurement, and the tool that smooths it adds another layer of comfortable fiction.
Hence a reading rule that is forgotten as soon as the curve is pretty: no movement shorter than the sampling period can be described. It may disappear entirely, appear truncated, or appear in a form that never existed when its frequency and sampling rate enter resonance. A rapid control oscillation, seen through a sampling rate that is too slow, may appear as a slow and steady drift — that is, as its opposite.
The same reasoning applies to resolution and range. A parameter coded with few bits produces a staircase that is mistaken for micro-corrections, whereas it is only the smallest representable step. A value that plateaus because the range is saturated is read as a stable hold at the limit, whereas the actual quantity may have continued to increase outside the measurement range.
The recorder only takes snapshots, not continuous video. If something happens faster than the sampling rate, it might not show up at all. A slow-looking drift could actually be a fast oscillation that the recorder missed.
On a Boeing 737, the elevator position is sampled at 4Hz (4 times per second). If a pilot makes a quick correction that lasts less than 0.25 seconds, the recorder might miss it entirely. The curve would show a smooth transition, even if the real movement was jerky.
The trap of the fixed parameter. A lost input, an invalidated sensor, or an incomplete frame most often produce a value that stops being refreshed. It is then plotted as a perfectly horizontal line — the most readable and reassuring trait of the graph — and is spontaneously read as a deliberate and controlled hold. Only the frame validity indicators and the behavior of neighboring parameters allow distinguishing between « it was held » and « it was no longer measured. »
Two time bases, one chronology.
Cross-reconstruction begins with a thankless task: alignment. Parameters and voice do not share the same clock, and the gap between them is neither zero nor constant. You do not align by superimposing two displayed times; you align on events that leave a trace on both sides. The transmission alternation is the most convenient: it appears as a discrete in the frame and is heard on the track. A sound alarm from a system offers the same double signature, since its trigger is itself parametric. A maneuver that is both noisy and recorded — landing gear extension, high-lift device extension, ground contact — completes the set of anchors.
Three anchors are better than one. Two give a shift; three reveal a possible drift, that is, a shift that changes over the course of the recording. Ground communication recordings and surveillance data provide an additional clock, independent of the first two, and allow verifying the alignment rather than assuming it.
As long as this alignment is not established and documented with its uncertainty, any statement of the form « he announces this at the moment when the parameter does that » is a figure of style. Many of the causalities felt when reading a report actually stem from a few tenths of a second of alignment.
The right reflex before commenting on a shape. Demand three things before the first interpretive sentence: the type conversion document — source, unit, range, and period of each parameter —, the state of validity controls on the studied window, and the temporal anchor retained with its uncertainty. Without these three elements, you do not comment on a recording: you comment on a drawing.
From data to fact, from fact to intention.
A flight data recorder analysis progresses in steps, and each step consumes an additional hypothesis. The first step is the data: a value, a unit, an instant, accompanied by a validity indicator. The second is the fact: the data becomes a fact when an independent source confirms it — another physically linked parameter, a radar trace, a material finding on the wreckage, a laboratory test on the equipment. A single parameter establishes nothing; two parameters that cannot lie together establish much.
The third step is the behavior: you describe what the system and the crew did, based on a model of the aircraft’s operation. This is already an interpretation, as it assumes that the model is correct and that the equipment was behaving as expected. The fourth step, the intention, is not reachable by the data. No combination of parameters says what the crew expected, what they believed they had selected, or what they had stopped monitoring.
This last step is the one that public comments take in a single step, and that seriously written investigation reports refuse to take. They describe facts, state hypotheses by naming them as such, and leave visible the areas where the data does not allow choosing between two explanations.
Data alone can’t prove intent. First, you need confirmed facts (like two matching parameters). Then, you can guess behavior—but never what the crew was thinking. Good reports admit when data can’t answer a question.
If a recorder shows the autopilot disengaged at 10:05:03, that’s a fact. But was it the pilot, a protection system, or a sensor failure? The data can’t say. Only crew interviews (protected by law) can reveal intent.
| Observation in the data frame | Established fact | Admissible inference | Beyond the reach of the data |
|---|---|---|---|
| Elevator position varying | The surface occupied these positions at these moments | A command was applied in this direction | Who produced it, with what force, in response to what cue |
| Selected altitude changed on the bus | This value was transmitted and taken into account | A selection was made in the cockpit | Whether it was intended, cross-checked, or inherited from a mode change |
| Autopilot disengagement discrete | The system changed state at this moment | An action or a protection intervened | The exact cause and when the crew perceived it |
| Prolonged silence on the voice track | Nothing spoken was picked up over the window | High workload, or routine task | What each person was looking at, expecting or had stopped monitoring |
| Parameter constant for several seconds | The transmitted value did not change | Steady hold, or loss of refresh | Which of the two, without the validity checks |
Voice recording gives the spoken, never the thought.
The voice recording is often presented as the direct access to the crew’s reasoning. It actually gives the verbalized, which is only a fraction of the thought, and a selected fraction. A standard announcement can be an automatic phrase pronounced while attention is elsewhere; the connection between the words and the recorded action at the same instant is sometimes a procedural coincidence, not proof of awareness.
Silence, on the other hand, means nothing by default. It may reflect a saturated workload, a routine task, a well-oiled tacit management between two people who have flown together for years, or a stupefaction. Non-verbal sounds — alarms, selector clicks, alternations, breathing rhythm, aerodynamic noise — often carry more exploitable information than the phrases, because they are dateable and cross-referenced with the parameter frame.
Remain the cases where the crew is available: the interview and the debrief. These are the only sources that can carry the intention, and they have their own limits. The narrative is reconstructed afterward, smoothed, and contaminated by the knowledge of the outcome. A good interview asks what was expected at that moment, which indicators were monitored and which were not — much more than « why. » The legal and contractual protection of these testimonies is not a favor: it is the condition for them to describe a reality rather than a defense.
The data describes the world as the aircraft believed it to be.
A principle often reversed deserves to be stated correctly: the flight data recorder does not record the actual state of the aircraft; it records the state that the systems calculated — the one that was feeding the displays. When a source is faulty, the recording carries the fault. This is a stroke of luck, not a handicap: the frame then approaches what the crew had in front of them, while the actual state must be reconstructed by other means — aerodynamic model, unaffected sources, surveillance data, material marks.
Therefore, two trajectories must be distinguished, and they must never be confused in the same sentence. The perceived trajectory is the one the aircraft displayed and recorded. The actual trajectory is the one reconstructed after the accident, with information that no one had on board. Judging a decision based on the latter is producing pure hindsight bias. A maneuver that is incoherent in light of the actual trajectory may be perfectly coherent in light of what was displayed — and it is this coherence that an investigation seeks, because it alone explains and allows correction.
The recorder shows what the aircraft’s systems believed was happening—not reality. If a sensor fails, the recorder captures the wrong data, which is still useful because it shows what the crew saw. Always compare the recorded data with the actual state later.
On an A330, if the airspeed sensor ices over, the recorder shows the wrong speed. But this is exactly what the pilots saw on their instruments. The actual speed (reconstructed later) might be 10 knots higher—but the crew’s decisions were based on the faulty data.
What this changes in ordinary exploitation.
The same limits apply to the monitoring of flight data, which draws from the same acquisition and often from the same quick-access recording equipment. An event detected by an analysis program is a threshold crossing on a parameter, with its period and validity: it is a signal, never a fault. Two crews producing the same curve may have experienced two unrelated situations, and the program makes no distinction between the two.
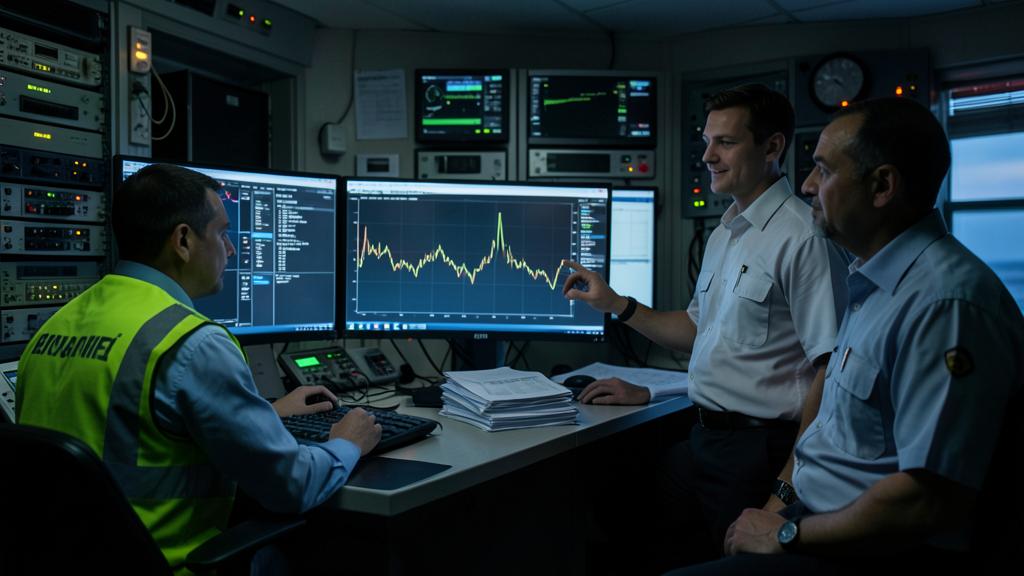
Hence the decisive role of the debriefing conducted under anonymity by the designated correspondent: it is the only place in the chain where the intention enters the file. An exploitation that removes this debriefing to save time keeps the curves and loses exactly what the curves do not carry. The exchanges between peers on analysis practices show, moreover, that the quality of a program is judged by the richness of its debriefings much more than by the number of detected events.
Three checks are worth making in your own documentation: which parameters the fleet actually records, and at what rate each; which are measured directly and which are calculated by an intermediate equipment, therefore dependent on its health; finally, who holds the up-to-date conversion document and the associated equipment version. Without this last document, an extraction remains a sequence of numbers.
Gray areas remain, and it is better to name them. On many aircraft, the control force is not recorded while the position is, making certain situations with opposed controls undecidable. Parameters shared between the protected recorder and a quick-access recorder may be sampled differently and tell two slightly offset stories of the same second. For those preparing a qualification or an investigation function, knowing how to cite these limits is better than knowing how to plot a curve: it is what separates a reading from a comment.
This article presents a reading method, not a standard: the applicable texts, the operator’s approved documentation, and the conversion document specific to the type and equipment version prevail over everything that precedes, and are authoritative in case of discrepancy.


Leave a Reply
You must be logged in to post a comment.