
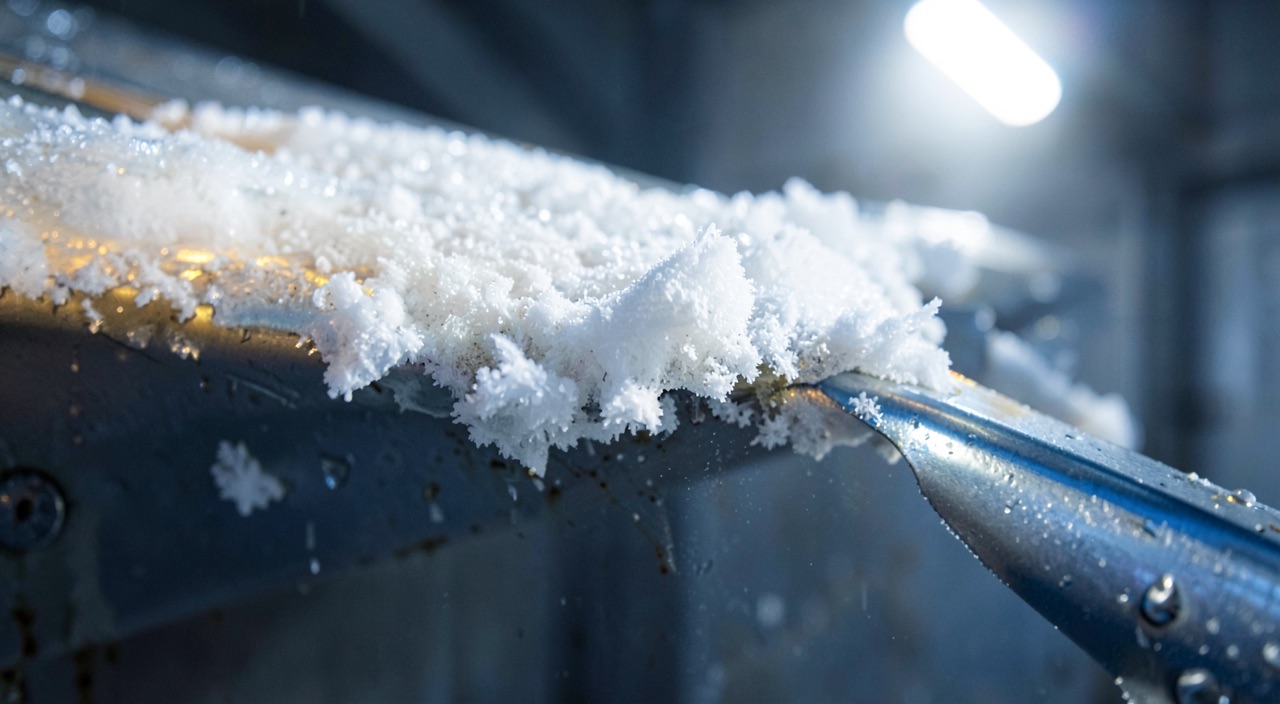
An icing certification file contains very few pictures of actual cloud. It contains liquid water content curves, ice shapes cast in a workshop, stall tests flown in clear air, and a few dozen hours spent hunting a stratiform layer wherever the season promised one. The question every practitioner asks when facing the limitations in their flight manual is simple: which of those hours actually wrote the number they now apply?
What the Demonstration Must Actually Establish
Icing certification does not require proving that an aircraft can fly through a cold cloud. It requires establishing three distinct things, none of which is obtained by the same means: that the protection performs its function across the whole retained envelope, in normal operation as well as after the failures that must be tolerated; that the aircraft keeps acceptable handling qualities and margins with the residual deposit that survives the protection; and that the crew has the cues and procedures to recognise the situation and get out of it.
The conditions envelope is a construct. It codifies a liquid water content, a median drop diameter, a temperature and a horizontal extent, with the implicit rule that high contents are brief and low contents last. No real cloud matches any single point of this envelope: it is a statistical shaping meant to make sizing reproducible. A second envelope is added to it, that of supercooled large drops, which cannot be derived from the first because the impact physics changes in nature there.
The certification process doesn’t test real clouds, but uses mathematical models to predict ice buildup. These models create “envelopes” of conditions that represent the worst-case scenarios for ice formation. The goal is to ensure the aircraft can handle these conditions safely, not to prove it can fly through any actual cloud.
An Airbus A320 flying at FL250 (25,000 feet) in a cloud with 0.5g/m³ water content at -10°C would need to demonstrate handling qualities with a specific ice shape on its wings. The certification process would use this envelope point to design the test, even if the actual cloud encountered might be slightly different.
From this envelope, the manufacturer derives accretion cases, that is, exposure scenarios. It is these, not the raw envelope, that drive the test programme.
| Case | What it represents | What it mainly sizes |
|---|---|---|
| Takeoff | Brief exposure from power application | Second-segment margins |
| Holding | Long exposure, flaps and slats retracted | Often the critical aerodynamic case |
| En route | Layer crossing at low temperature | Thermal load, bleed air demand |
| Approach and landing | High-lift configuration with residual deposit | Reference speeds, roll control |
| Delayed activation, intercycle | Deposit before activation, then between cycles | Pneumatic boot systems |
| System failure | Protection lost in whole or in part | Time to exit, associated limitations |
The Ice Shape Is a Design Case, Not an Observation
The deposit is not ice simply laid down: it is the result of a local thermal balance. A drop that strikes the leading edge releases its latent heat as it freezes; if everything freezes on the spot, the deposit stays opaque and porous and extends the nose along the relative wind axis. If only a fraction freezes, the rest runs back before setting, and the deposit builds up as horns on either side of the stagnation point. It is these horns, geometrically modest, that cause the most penalising separation: they sit exactly where the suction peak used to form.
Two consequences confirmed by test rigs and rejected by intuition. The first: it is not the largest shape that is the most critical. A bulky, smooth, well-aligned deposit sometimes costs less in maximum lift than a ridge only a few millimetres thick placed in the right spot. The second: a surface with a small leading-edge radius captures proportionally more than a thick wing. The horizontal stabiliser, thin and invisible from the flight deck, therefore accumulates faster than the wing that everyone is watching.
The shape of ice on an aircraft’s wings isn’t just about how much ice forms, but how it forms. If ice freezes immediately, it creates a smooth, tapered shape. If it runs back before freezing, it forms horns that can disrupt airflow more than a thicker, smoother deposit. The thinnest parts of the aircraft, like the horizontal stabilizer, can collect ice faster than the wings because they have a smaller leading edge radius.
On a Boeing 737, a thin ridge of ice just 3mm thick on the upper surface of the wing, right behind the protected zone, can cause a more severe stall than a thicker, smoother deposit. This is because the ridge disrupts the airflow exactly where the suction peak used to form, reducing lift more dramatically.
Natural Icing: the Full Proof, the Least Controlled
The natural icing campaign remains the only moment when the certified aircraft meets the real condition, with its duration, its turbulence, its unsorted drop spectrum and its drifting temperature. The aircraft flies instrumented: hot-wire water-content probes, drop-size spectrometers, cameras trained on witness areas, sometimes a chase aircraft photographing the accretion in flight. What is checked there is what no rig can give: the coherence of the whole system — protection, detection, engines, pressure and angle-of-attack probes — in an atmosphere that cannot be dialled in.
Its weakness is structural: the cloud cannot be commanded. Finding, at the right flight level, a layer that holds the desired water content over the desired extent and at the desired temperature is a matter of a seasonal campaign and luck; many sorties return with an accretion too thin to be usable. Nothing guarantees that the point encountered is the sizing point, nor allows it to be repeated the next day. Natural icing validates a demonstration chain that has already been built; it does not replace it.
Behind the Tanker Aircraft: a Made-to-Measure Cloud, the Size of a Room
In-flight spray testing fills part of that gap. An aircraft fitted with a spray boom sprays water ahead of the test aircraft, which positions itself in the plume. Flow rate governs the water content, nozzle selection and pressure govern the drop diameter: a condition close to a given envelope point is obtained on demand, in genuinely cold air, with real airflow and real vibration.
The trade-off lies in geometry. The plume is a cylinder whose diameter is typically measured in metres: it wets a portion of the span, an air intake, a rotor, a probe, but never an entire aircraft uniformly. The usable band of altitude and temperature is narrow, the drop spectrum is not that of a cloud, and formation flying imposes its own discipline. Spray testing therefore excellently demonstrates the operation of a system — thermal load of a heated slat, efficiency of a boot cycle, behaviour of an air intake — and very poorly an overall aerodynamic penalty.
The Icing Wind Tunnel and the Altitude Rig: the Microscope
In an icing wind tunnel, the cloud becomes a setting. A calibrated nozzle rack produces a fog whose content and drop-size distribution are measured and mapped across the test section, and the envelope is swept point by point, over a wing section or a nacelle model. It is the only means that offers repeatability, and therefore the only one that allows two solutions to be compared with all else being equal.
The price paid is representativeness. The section is not the wing, and scale imposes similarity laws: the aim is to preserve the drop trajectory, the accumulated water quantity and the frozen fraction all at once, three parameters that cannot all be satisfied on a scaled-down model. A wind tunnel test proves a physics, not an aircraft.
The same reasoning applies to engines, with an added difficulty. At high altitude, near convective systems, what threatens the core is not the supercooled drop but the ice crystal: it passes through the protection without adhering to it, melts on contact with hot parts, then refreezes downstream. The phenomenon is reproduced neither in a drop cloud nor in a conventional icing wind tunnel; it requires an altitude rig generating a calibrated crystal cloud. The demonstration is then entirely conducted on the ground.
Computation: What Makes the Rest Transposable
Between the measured points, an accretion code interpolates. It solves the flow around the aerofoil, computes the drop trajectory and the resulting collection efficiency, then applies the surface thermal balance to decide what freezes, runs back or evaporates. The output: a shape, for a given envelope point and exposure duration.
This computation is not a standalone proof: it is only credible because it has been anchored against wind tunnel tests, which are themselves checked against photographed natural accretions. Its real value lies elsewhere. It makes it possible to sweep the entire envelope, sort through the possible combinations, and extract the handful of critical shapes that will actually be manufactured. Without it, a test would be needed for every point; with it, a test is needed for every anchor.
Applied Shapes: Where the Aerodynamic Demonstration Is Won
Most of the penalty figures carried in a flight manual come from tests flown in clear air. The shapes selected are cast, in composite or machined foam, reproduced across the relevant span, textured to reproduce the deposit’s roughness, then fixed to the leading edges. The aircraft then flies a standard programme: clean and high-lift-configuration stalls, buffeting, roll control, climbs, landings.
The method has three decisive virtues. It is repeatable, since the contamination is identical from one flight to the next. It is conservative, since the critical shape is installed rather than whatever shape the day happens to produce. It is safe, since nothing detaches and the test crew approaches the limits with a known configuration. In return, it only demonstrates what has been fitted: geometry, roughness and spanwise extent are three assumptions, and the result is only valid for those.
What Each Means Demonstrates, and What It Leaves Aside
| Means | Control of the cloud | What it actually establishes | What it leaves out of reach |
|---|---|---|---|
| Accretion code | Total, but simulated | Sweeping the envelope, sorting critical shapes | Any validity not anchored against a test |
| Icing wind tunnel | Calibrated, repeatable | Physics of accretion, comparison of solutions | Scale effects, handling qualities |
| Spray tanker aircraft | Adjustable, but local | Systems in real flight, at real temperature | Full-span accretion, overall penalty |
| Applied shapes | Not applicable: shape imposed | Speeds, margins, degraded handling qualities | Fidelity of the shape, a deposit that evolves |
| Natural icing | None | Overall coherence in an unsorted condition | Repeatability, the sizing point |
Two Misunderstandings That Run Through Briefing Rooms
The trap. The idea that the deposit should be allowed to thicken before triggering a boot system, on the grounds that too thin a layer would simply mould itself around the boot without cracking, belongs to folklore, not to the certification file. The delayed-accretion case does appear in it, but as a tolerance scenario for a late activation: a case that is endured, never a technique. Deliberately waiting means stepping outside the set of shapes that was used to establish the flight manual’s figures.
The right reflex. Look in the approved documentation for which accretion case the speed increments you apply are tied to, and for how long they hold. Most are written for a residual deposit that persists after leaving the cloud: they therefore do not lapse the moment the last layer is crossed, but only once visual confirmation that the witness surfaces are clean has been made.
The second misunderstanding concerns the horizontal stabiliser. It captures faster than the wing, it is not visible from the flight deck, and its contamination manifests through symptoms opposite to those of a wing stall, often during flap extension. Since recovery actions differ depending on the surface, it is best to know before the flight what the documentation prescribes for each.
What Still Needs Checking in One’s Own Documentation
Three points deserve a careful reading rather than habitual trust. The status of supercooled large drops first: an aircraft may be certified to operate within them, or only to exit them within a given time — in which case the visual cues described by the documentation are an operational limit, not comfort information. The logic of detection and activation next: automatic, on a primary detector, or manual on a visual cue, it leads neither to the same actions nor to the same time limits. Finally, the unprotected witness surfaces, and what their condition allows one to conclude about the rest of the airframe.
There remains an acknowledged grey zone. Ice-crystal icing at altitude, ground contamination from freezing precipitation just before lining up, accumulation on secondary structural elements: these subjects fall under distinct certification bases or operating regulations, and are not covered by the applied shapes from which published speeds derive. For anyone preparing a type rating, this is where the examiner’s questions live that separate recitation from understanding, and it is why icing deserves to be treated as a performance chapter as much as a systems one. The FL330 technical community and the type-rating preparation modules come back to it regularly.
This article describes a demonstration mechanism, not an applicable rule. In the event of any discrepancy, the certification specifications in force, the aircraft’s own certification basis, and the operator’s approved documentation prevail over everything above.
Questions fréquentes
Why are most icing stall tests flown in clear air?
Because the shape of the deposit must be known, identical from one flight to the next, and chosen as the critical case. A natural accretion is constantly changing and cannot be reproduced, which rules out any comparison between two flights. Cast shapes, fixed to the leading edges, make the test repeatable and conservative, and prevent a piece from detaching while exploring the low-speed regime.
So what is the natural icing campaign for, if it does not provide the figures?
It checks the coherence of the whole system in an unsorted atmosphere: protection, detection, engines, pressure and angle-of-attack probes, crew procedures. It is also used to compare real accretions against calculated shapes, which anchors the credibility of the accretion code. It is a chain validation, not a source of certified values.
Is a test behind a spray tanker aircraft worth as much as a natural cloud test?
Not for the same questions. The spray plume offers an adjustable water content and drop-size distribution in genuinely cold air, which is perfectly suited to demonstrating a protection system, an air intake or a probe. But it only wets a limited portion of the aircraft and therefore cannot establish an overall aerodynamic penalty.
Why is the horizontal stabiliser treated separately in icing files?
Its leading edge has a smaller radius than the wing’s, which increases the collection efficiency for drops: it accumulates faster for the same exposure. It is also rarely visible from the flight deck. Its contamination shows up through symptoms distinct from those of a wing stall, often during flap extension, and the recovery actions differ.
Should you wait for a certain thickness of ice before triggering a pneumatic boot system?
No. The delayed-activation case appears in certification files as an endured scenario, meant to show tolerance to a late trigger, never as a method to apply. The early activation prescribed by the approved documentation keeps the aircraft within the set of shapes used to establish the published speeds.
Does ice-crystal icing at altitude fall under the same demonstration?
No, it falls under a distinct demonstration, conducted mainly on the ground. Crystals do not deposit on cold surfaces the way supercooled drops do: they pass through, melt on contact with hot engine parts, then refreeze downstream. Reproducing them requires an altitude rig generating a calibrated crystal cloud, not a conventional icing wind tunnel.


Leave a Reply
You must be logged in to post a comment.