
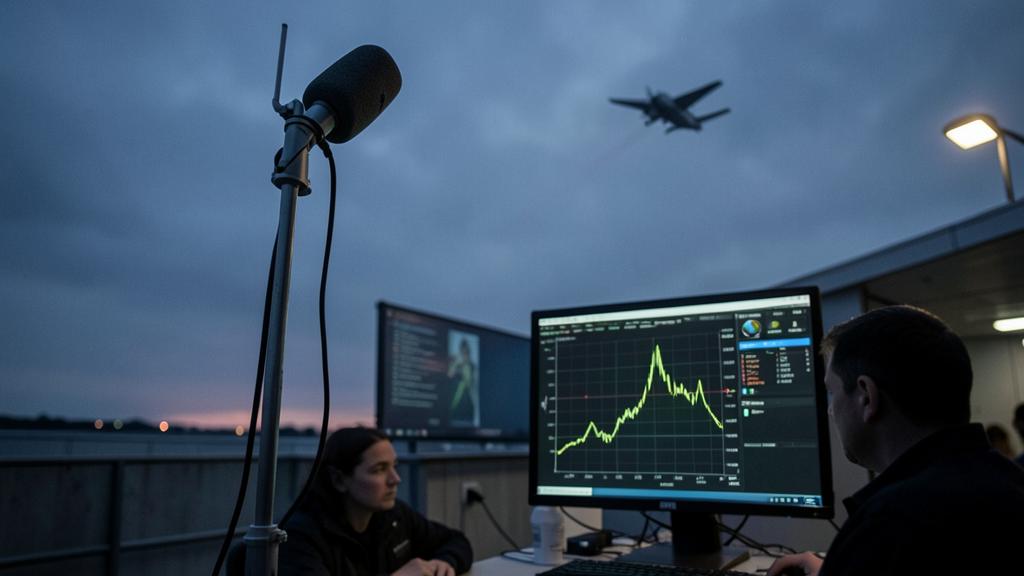
A letter arrives at the environmental service: « On the 12th, around 22:15, an aircraft flew very low over the house, it had never been that loud. » The nearest station did record an event, with a maximum timestamped to the second. Three departures are listed in the timeframe. The entire case hinges on this discrepancy: a sensor that doesn’t know what it heard, a trajectory that doesn’t know what it produced, and a complaint describing a nuisance rather than a flight.
What a station measures, and what it ignores
A permanent airport noise monitoring station is a Class 1 precision sound level meter, with a microphone atop a mast, protected from wind by a foam ball, periodically calibrated, and continuously connected to a processing center. What it produces is not a list of aircraft: it’s an instantaneous A-weighted sound level, sampled without interruption, from which events are later extracted.
The elementary object is called an acoustic event, and its definition is purely acoustic: the level exceeds a threshold, remains above it for a minimum duration, and stands out from the background noise. None of these three conditions mention an aircraft. A heavy truck climbing a ramp, a lawnmower, or a clap of thunder can trigger the same logic. The station detects noise; everything else is inference.
Background noise itself is a separate measured object, represented by a statistical indicator of the level exceeded most of the time. It is not stable: it rises with morning traffic, drops in the middle of the night, changes with the season, and increases with rain, which establishes its own baseline. A fixed threshold applied to a moving background does not capture the same population of events at different times.
For each event, at least three parameters are recorded: the peak level, the duration, and the total acoustic energy normalized to a reference second. The latter, the sound exposure level, is the only one that accounts for the fact that a long, moderate passage can deliver as much energy as a short, intense one.
One point must be clarified immediately, as it fuels half of the misunderstandings in committees: the level recorded by a station has no relation to the aircraft’s acoustic certification level. Certification is expressed in units of perceived noise at three reference points—lateral, flyover, and approach—with a specified mass, atmosphere, and flight profile. The station measures A-weighted decibels at an arbitrary location, with the mass, wind, and configuration of the day. The two numbers are not comparable.
Une station de mesure du bruit ne reconnaît pas les avions, elle enregistre juste quand le bruit dépasse un certain niveau. Ce qu’on entend dépend aussi du bruit de fond (comme le trafic ou la pluie) et de la façon dont le son voyage dans l’air. Les chiffres qu’elle donne ne sont pas les mêmes que ceux utilisés pour certifier les avions.
Un Airbus A320 décolle à 22h15 sur une piste de 3 000 mètres. La station enregistre un pic de 85 dB(A) trois secondes après le passage du point le plus proche, situé à 3 km. Pourtant, un autre avion a décollé 10 secondes plus tard, et le bruit pourrait lui être attribué à tort.
From decibels to flight: matching and corrections
Linking an event to a flight is a three-input matching problem: the event’s timestamp, the station’s position, and surveillance data—a sequence of dated positions refreshed every few seconds. The result is never obvious; it comes from a chain of corrections, each of which can be applied incorrectly.
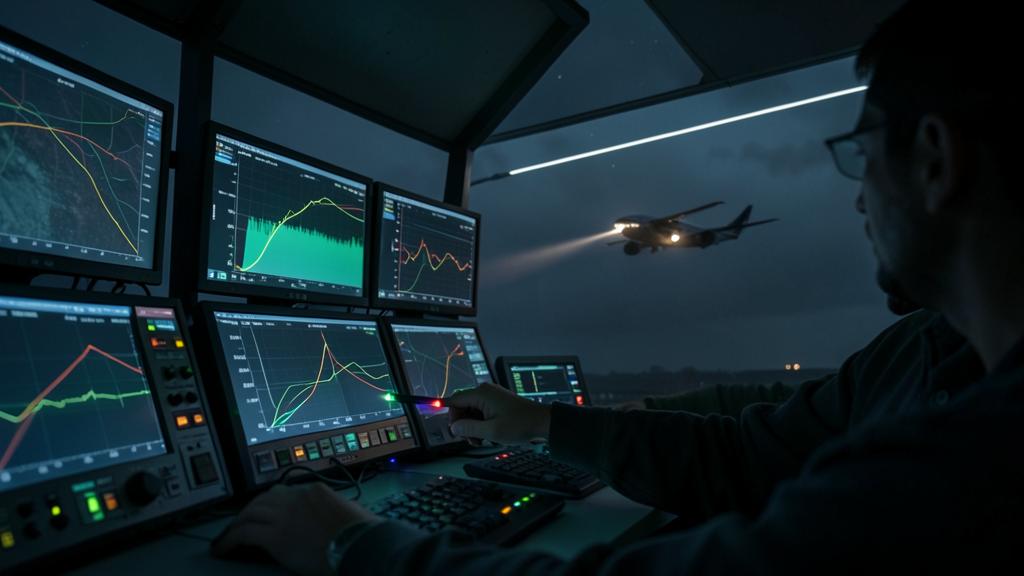
The first correction is the most often forgotten: sound travels slowly. It takes about three seconds to cover a kilometer. An aircraft whose closest point of passage is three kilometers away will have its peak noise heard about ten seconds after passing. Failing to correct, or correcting in the wrong direction, shifts the search window enough to attribute the noise to the next flight.
This correction is circular: the delay depends on the distance, the distance depends on the flight, and the flight is precisely what we are trying to identify. The process involves iteration—wide window, list of candidates, calculation of the closest point of passage for each, delay correction, narrowing, and re-evaluation.
The second correction concerns geometry. What governs the received level is not altitude but slant range. A flight laterally offset by one or two kilometers at low altitude may be farther from the station than a much higher flight passing directly overhead, yet it may be louder: at a low elevation angle, the fuselage no longer masks the engines in the same way, and ground effect varies with the intervening terrain.
The third correction is for propagation. The level decreases by about six decibels every time the distance doubles, the atmosphere absorbs more at higher frequencies, and a wind gradient or temperature inversion bends acoustic rays toward the ground or sky. The same flight, on the same trajectory, will not produce the same reading on a calm night versus a windy afternoon.
The right reflex. Before discussing a reading, check its time reference and whether it has been corrected for propagation delay. An acoustic file in local time compared to a trajectory file in universal time produces a constant offset that no one notices—precisely because it is perfectly consistent: all events are attributed, all to the wrong flight.
When two departures become one
On a busy platform, two consecutive departures using the same procedure are separated by about one to two minutes. The decay of an event, however, lasts several tens of seconds. It often happens that the level has not dropped below the threshold when the next passage begins to rise.
The detector, which only processes threshold crossings, then records a single event. Its duration covers both passages, its peak is that of the louder of the two, and its energy combines both contributions. The file line is incorrect in all three columns, and nothing in the automatic processing distinguishes it from a valid line.
The phenomenon is not limited to aircraft. A train convoy, a gust on the microphone cover, or a storm can equally mask a real passage. Conversely, a distant flight may remain below the threshold and not appear in the data, even though a resident between two stations heard it clearly—the network’s coverage is punctual and interpolates poorly.
The trap. A high correlation rate over an entire day says nothing about the reliability of an individual line. The network correctly matches a population of events to a population of flights: it is a statistical result. Drawing individual attribution from a cluster of closely spaced departures is applying a guarantee that has never applied to a single case.
Indicators, and what each proves
The confusion between indicators is the other major source of miscommunication between the operator, residents’ associations, and elected officials. Each answers a specific question, and only that one.
| Indicateur | What it captures | What it does not tell | Usage courant |
|---|---|---|---|
| A-weighted maximum of an event | The peak level reached during the pass | Neither duration nor energy: two very different passes can share the same maximum | Comparing passes, setting detection thresholds |
| Sound exposure level of the event | The total energy of the pass, normalised to a reference second | How that energy was distributed over time | Summing events, feeding long-term indicators |
| Equivalent level over a period | The average energy of the time slot, aircraft and everything else combined | What share is due to air traffic | General sound environment of a site |
| Day-evening-night indicator | Average annual exposure, with evening and night conventionally weighted | What actually happened on a given evening | Noise maps, noise exposure plans, planning decisions |
| Number of events above a threshold | The frequency of audible passes | Their intensity, and the actual source of each line | Monitoring repetition, dialogue with local residents |
| Background level | The site’s noise floor at the hours considered | The very existence of events: it excludes them by design | Calculating emergence, configuring detection |
A key point to understand in consultative committee meetings: noise maps and exposure plans are not drawn from station data. They are calculated by a model fed by annual traffic, fleet composition, published procedures, and average trajectories; the stations are used to verify that the model does not drift. Comparing an evening’s reading to an exposure plan curve is comparing a punctual measurement to an annual average model: both can be accurate and contradict each other.
The gap between decibels and annoyance
A complaint is not a measurement. It describes a nuisance, and annoyance depends on more than just the peak level.
The first factor is emergence—the gap between the event and the background from which it stands out. The second is the rise rate: a level that builds gradually is tolerable, while one that surges in two seconds causes a jolt, and at night, a wake-up. The third is the spectral composition—a marked tonal component, such as the cavity resonances of certain aircraft in clean configuration, remains identifiable and irritating at an overall level that the station considers ordinary. The fourth is repetition: at equal total energy, a large number of moderate events is more annoying than a single intense event, because each one interrupts something.
Then there is the phrase that appears in almost every letter: « It was very low. » Perceived altitude is not observed; it is reconstructed from the level, angle, and context. A laterally offset flight, seen from the side with exposed engines, appears lower than a closer flight passing overhead. Disputing the complaint on this point leads nowhere: the resident accurately describes what they perceived, and their perception is not an altimeter.
What correlation allows us to conclude
There are actually two distinct questions, which everyday language constantly confuses.
The first: which flight produced this noise? It is acoustic, and its answer is sometimes undecidable, as we have seen. The second: did this flight follow the published procedure? It is purely geometric. It requires no microphone, only a trajectory, a procedure, and a tolerance. And it is this one that has consequences, because a proven trajectory deviation can be qualified and sanctioned, whereas a strong but compliant noise cannot.
Measurement establishes a nuisance, not a fault. A perfectly compliant flight can produce the highest reading of the month, while a significant deviation from the prescribed trajectory goes unnoticed on the ground.
When attribution must hold up in a control body, it rests on a chain of evidence, each link of which is verified separately: synchronization of clocks to a common reference, traceability and integrity of surveillance data, validity of the periodic sound level meter verification, preservation of the raw signal and not just the calculated indicators. A station whose verification has expired does not produce a bad number: it produces an unenforceable number, which is not the same thing and is argued differently.
What this changes in practice
For the crew, the key moment is departure, and it hinges on the choice of the noise-abating procedure. The two standardized families serve different geographies. One reduces thrust early and delays acceleration and high-lift device retraction: the aircraft remains in a high-drag configuration longer, climbs faster above nearby areas, and pays the price farther away. The other accelerates and cleans up earlier: the near-field signature is worse, but the aircraft is higher and cleaner over distant areas.
The choice is not left to the crew on a case-by-case basis: it is set by the operator’s approved documentation, sometimes airport by airport, based on the distribution of the overflown population. The heights for thrust reduction and acceleration are in the same document and weigh more on the ground footprint than the aircraft type.
On arrival, the mechanism is different. At low power, it is no longer the engine that dominates but the airframe: gear down, slats and flaps extended, speed brakes deployed. A continuous descent, maintained smooth and at low thrust as long as traffic constraints allow, reduces both radiated energy and the number of affected residents, simply because it keeps the aircraft high longer.
The trap. Performance-based navigation has made trajectories highly repeatable. The result is paradoxical and widely observed on affected platforms: the exposed area decreases, the total number of exposed people decreases, and the number of complaints increases. A population once overflown intermittently, at the mercy of lateral dispersion, is now overflown on almost every flight, along the same axis. Presenting a reduced footprint as an improvement to a newly concentrated community is the best way to lose the room.
The right reflex. Record the reason for a deviation at the time it occurs: ATC instruction, contaminated runway, performance limitation, echo avoidance. The trajectory file will be reviewed months later, without the day’s weather, frequency, or context; only the written record restores what made the deviation necessary.
What to check
Several points can be verified directly in your own operator’s documentation, and it is better to know them before a file is escalated: which noise-abating departure procedure applies, and whether it is the same across all network airports; what trajectory-following tolerance is allowed and from what deviation a report is issued; who receives non-compliance notifications and how the crew is informed; how the flight data analysis program handles an environmentally significant deviation, and under what guarantee of fair culture.
A gray area remains, and it is more honest to name it than to smooth it over. On two parallel runways operated simultaneously, acoustic matching does not always discriminate between the two flows. A heavy aircraft flying high and a light aircraft flying low can produce the same peak at the station. Atmospheric refraction causes the reading of the same flight to vary from one evening to another in proportions that are not exactly correctable. These limits do not disqualify the network; they simply state what is reasonable to expect from it, and specific cases are usefully discussed among practitioners on forums.fl330.com.
For those preparing a type rating or line training, the practical consequence is simple: the noise-abating procedure is treated as an element of the departure briefing, on par with the engine-out trajectory, with its conditions of application and pivot point. It is covered in this context in the operational preparations offered on formations.fl330.com.
The applicable text, the airport’s specific instructions, and the operator’s approved documentation take precedence in all circumstances over this article, which is merely explanatory.


Leave a Reply
You must be logged in to post a comment.