

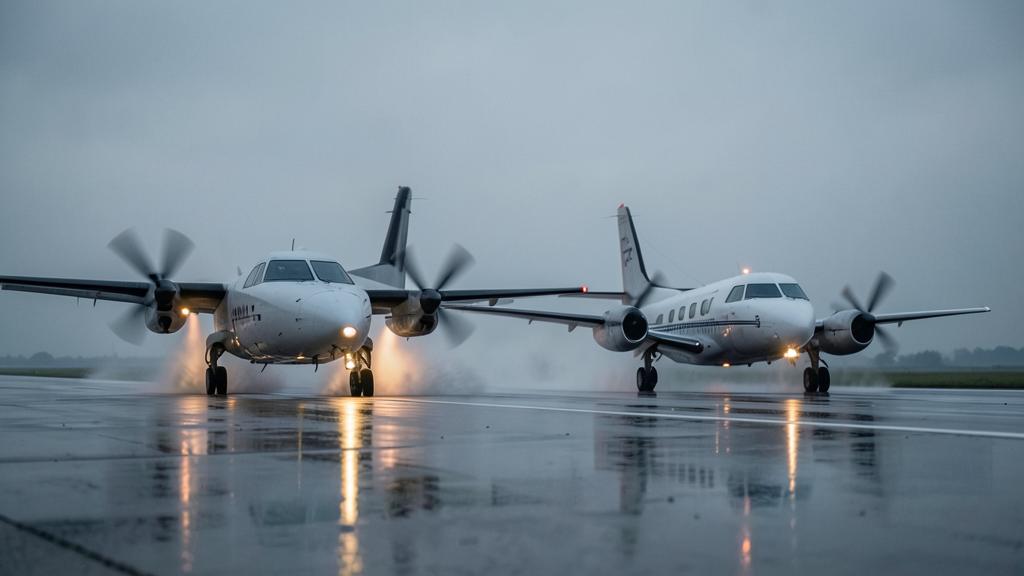
Same terrain to clear, two aircraft on the ramp: the regional turboprop will manage a gradient the twinjet cannot hold, and will then be overtaken higher up, in the climb towards cruising level. This is not a question of installed power. It is that one sells power and the other sells thrust, and that the climb is paid for in both currencies at once: the angle out of excess thrust, the rate out of excess power. Everything else — holding speed, glide speed, economic cruise speed — follows from that same division.
Two engines, two currencies
A turbofan, at a given rating and altitude, delivers a thrust that varies little with speed across the operating range. The mechanism is a momentum balance: net thrust is the difference between the accelerated outgoing flow and the incoming flow, which already arrives at flight speed. As speed rises, this ram drag grows and eats into the difference; in the opposite direction, ram compression at the air intake raises the pressure at the fan and gives back part of the shortfall. The net result is a slight dip followed by a partial recovery. To first order, and this is how it should be remembered for reasoning purposes: constant thrust.
A propeller aircraft is a power machine. The turbine delivers to the shaft a power that depends on ambient density and temperature, and little or not at all on flight speed. It is the propeller that converts: T = η · P / V. Thrust is therefore a decreasing function of speed, a hyperbola trimmed at both ends. At the low end, propeller efficiency collapses — a blade at high angle of attack, largely stalled, churns air that it barely accelerates in the right direction — which bounds static thrust instead of letting it diverge. At the high end, blade-tip Mach number and the residual blade angle of attack close the useful range, and it is this limit, not airframe drag, that caps the cruising speed of the family.
The consequence is visible from brake release. The jet accelerates at roughly constant thrust: acceleration slackens only under the effect of rising drag. The propeller, for its part, starts with considerable thrust that degrades as speed builds. Hence the character of each family: one excels where an obstacle must be cleared from a short runway, the other where a high speed must be held for hours.
Jets produce thrust that stays almost the same at different speeds, while propellers produce thrust that drops as speed increases. This means jets are better at high speeds and propellers are better at low speeds, like taking off from short runways.
A turboprop like the ATR 72-600 can clear a 50-foot obstacle in 1,200 feet of runway at maximum takeoff weight, while a regional jet like the Embraer E175-E2 needs 3,500 feet for the same obstacle. But at cruise, the jet flies at 450 knots while the turboprop maxes out at 280 knots.
What the aircraft demands: drag on one side, power on the other
Facing this supply, the demand. At fixed mass and altitude, drag breaks down into a parasite part that grows as the square of speed and an induced part that falls off as its inverse. The sum passes through a minimum, at the speed where the two parts are exactly equal: this is the minimum-drag speed, in other words the best lift-to-drag speed. A single point, two names — and two useful properties: this speed depends on altitude only to second order when it is expressed as calibrated airspeed, and it follows the square root of mass. It is the reference speed of the drag polar; the one that comes next, the minimum-power speed, is distinct from it and never substitutes for it.
Power required, for its part, equals drag multiplied by speed. Multiplying by speed shifts the minimum downwards: the minimum-power speed is lower than the minimum-drag speed. For an idealised parabolic polar, it can be shown that the power minimum falls where induced drag is three times the parasite drag, and that the corresponding speed is obtained by dividing the minimum-drag speed by the fourth root of three — of the order of three quarters. The symmetry is elegant and worth remembering: the speed that maximises the ratio of speed to drag, that is, the best-range speed of a jet, is obtained by multiplying by that same factor, and there lies the mirror situation where parasite drag is three times the induced drag. Three reference speeds in geometric progression around a single one.
An order of magnitude follows, and it is often useful: at the minimum-power speed, drag exceeds minimum drag by a factor of two over the square root of three, some fifteen per cent. Flying to stay airborne for a long time therefore costs about one eighth of the lift-to-drag ratio compared with flying to go far. These ratios hold for an idealised polar: the real polar is not idealised, compressibility distorts it as soon as Mach number matters, and only the type’s own charts remain authoritative. What they do give is the right ranking reflex, the one that never gets the direction wrong.
Angle and rate are not two settings of the same parameter
Two equations suffice, and they do not measure the same thing. Climb gradient is written sin γ = (T − D) / W: it is an excess of thrust, divided by weight. Rate of climb equals that gradient multiplied by speed, that is Vz = V · (T − D) / W = (Pavailable − Prequired) / W. This time it is an excess of power. The best-angle speed maximises the first difference, the best-rate speed maximises the second. Nothing requires them to be close.
- On a jet, available thrust being roughly flat, thrust excess is greatest where drag is least: the best-angle speed falls on the minimum-drag speed. Best rate, on the other hand, obeys a different condition — the slope of the power-required curve must equal available thrust — which places the speed distinctly above, and the more so the more generous the thrust. Hence the wide, familiar gap between the two speeds of a jet, and the mediocrity of its rate of climb until speed has been built up.
- On a propeller aircraft, available power being roughly flat, power excess is greatest where power required is least: the best-rate speed falls on the minimum-power speed. Best angle this time maximises
η · P / V − D, whose optimum lies below the minimum-power speed. Two low and neighbouring speeds, then, against two widely separated speeds on the jet.
The trap. A gradient and a rate are not interchangeable, and converting one into the other goes through groundspeed. A departure that imposes a climb gradient translates into feet per minute by multiplying it by the groundspeed of the moment, not by the groundspeed at which the chart is tabulated: a strong tailwind in the climb, or a temperature that inflates true airspeed, demands an appreciably higher rate for the same gradient. Symmetrically, a rate imposed by air traffic control says nothing about obstacle clearance: at high speed, a fine figure on the vertical speed indicator may correspond to an insufficient gradient. And the direction of the reasoning matters: the rate is chosen from the gradient required, never the other way round.
The right reflex. Do the conversion once, in the right direction, before taxiing: gradient required multiplied by the groundspeed expected on the critical segment, with the day’s wind and temperature. Note the resulting rate as a floor to monitor, and remember that the currency of obstacle clearance is angle. When terrain closes in, what is given up is acceleration speed, not gradient — within the limits that the type’s configuration and procedures allow.
Six objectives, two powerplants
The same mechanics apply to every phase, provided one knows each time which quantity is to be made extreme. The table below is not a scale of values: it is a ranking map, to be checked against the type’s published speeds.
| Objective | Quantity to be made extreme | Jet aircraft | Propeller aircraft |
|---|---|---|---|
| Best climb angle | Maximum thrust excess | At the minimum-drag speed | Below the minimum-power speed |
| Best rate of climb | Maximum power excess | Distinctly above minimum drag | At the minimum-power speed |
| Holding, maximum endurance | Minimum hourly fuel consumption | At the minimum-drag speed | At the minimum-power speed |
| Maximum range | Minimum fuel per unit distance | Above minimum drag | At the minimum-drag speed |
| Maximum glide distance | Maximum lift-to-drag ratio | At the minimum-drag speed | At the minimum-drag speed |
| Maximum glide duration | Minimum rate of descent, hence minimum power required | At the minimum-power speed | At the minimum-power speed |
Two readings are called for. First the diagonal: the minimum-drag speed serves the jet for climb angle and for holding, whereas it serves the propeller for range cruise; the minimum-power speed serves the propeller for rate of climb and for holding, whereas it serves the jet only with engines shut down. Then the last two rows, identical: as soon as thrust disappears, the powerplant ceases to intervene and only the drag polar remains. The glide is the only regime in which both families reason with the same figure.
Holding and cruise, or the same mechanics applied to fuel
Fuel consumption reflects the currency of each powerplant. On a jet, hourly consumption follows thrust fairly closely; and in stabilised level flight thrust equals drag, so hourly consumption is least at the minimum-drag speed. This is why a jet holds at its best lift-to-drag speed, the one that some types make visible with a dedicated bug on the speed scale. On a propeller aircraft, hourly consumption follows shaft power: the minimum therefore falls at the minimum-power speed, which is lower, and holding is flown there.
For range, one no longer minimises per hour but per mile: the ratio of speed to consumption must be maximised. The jet thus maximises the ratio of speed to drag, which places it above the minimum-drag speed; the propeller maximises the ratio of speed to power, that is, the inverse of drag, and ends up exactly at the minimum-drag speed. The economic cruise of a turboprop is therefore, to a first approximation, its best lift-to-drag speed — the same value as its glide speed, which simplifies life. That of a jet never is, and is in practice bounded by compressibility and arbitrated by a cost index that weighs fuel against time.
Two practitioner’s caveats. Published holding speeds are not these optima: they incorporate a manoeuvre margin, a minimum clean speed, the chosen configuration and sometimes airspace or separation constraints. And the variation of specific fuel consumption with engine rating, neglected above, slightly shifts the real optima. It is therefore the operator’s documentation values that are flown, the reasoning serving to understand why they fall where they do and in which direction they move.
The glide erases the difference, engine failure restores it
With zero thrust, the gradient becomes sin γ = − D / W: it depends only on the lift-to-drag ratio. Maximum distance is obtained at the minimum-drag speed, maximum duration at the minimum-power speed, and these two speeds are separated by the same factor as above. The optimum glide angle, for its part, does not depend on mass: it is the speed at which it is obtained that follows the square root of mass. A distance to cover and a time to gain are therefore not the same problem, and one must have chosen which one is being dealt with before settling on a pitch attitude.
Engine failure, on the other hand, clearly separates the two families. On a propeller aircraft, everything depends on feathering: a feathered propeller restores an almost clean airframe, a windmilling propeller creates drag out of all proportion to its projected area, to the point of dominating the balance, collapsing the lift-to-drag ratio and shifting the reference speeds. On a jet, the drag of the windmilling fan and that of the rudder deflected to hold the trajectory add up, but the loss bears above all on available thrust — and the excess, which is a difference, falls far more than the fraction of thrust lost. It is that excess that the gradients required by certification constrain, segment by segment.
The trap. Below the minimum-drag speed, slowing down increases drag: the regime is unstable in the energy sense, and every pitch-up to hold altitude worsens the deficit it claims to fill. Perception differs according to the powerplant, and that is where reflex goes wrong: on a propeller, available thrust rises as speed falls, which masks the degradation for a while; on a jet, thrust stays flat and the deficit accumulates with nothing to damp it. An engine failure at low speed, with gear and flaps extended, places the aircraft precisely on that wrong side.
The right reflex. Know your best lift-to-drag speed at the current mass as a single number, clean, and treat it as a floor for any performance manoeuvre. Before asking the aircraft for gradient, check which side of that number you are on. On the right side, a measured pitch-up converts speed into altitude; on the wrong side, it consumes both, and the only way out is to give back angle of attack and accept losing a few feet.
What moves these speeds
The two reference speeds are not constants of the type but functions of the aircraft’s state. Four factors govern them, and it is better to know which way each one pushes before reading a chart.
| What changes | Minimum-drag speed | Minimum-power speed | Available excess |
|---|---|---|---|
| Higher mass | Higher, as the square root of mass | Higher, in the same ratio | Reduced, since the drag to be balanced increases |
| Higher altitude, at equal mass | Little changed in calibrated airspeed, higher in true airspeed | Same behaviour | Reduced; thrust and power decrease with density |
| Flaps and gear extended | Lower, since parasite drag increases | Lower | Strongly reduced |
| One engine failed, propeller feathered | Little displaced | Little displaced | Reduced well beyond the fraction of thrust lost |
| One engine failed, propeller windmilling | Markedly displaced, the polar being changed | Markedly displaced | Collapsed |
| Bleed air and engine anti-ice in use | Unchanged | Unchanged | Reduced, without the demand changing |
| Airframe contamination or icing | Direction not generalisable | Direction not generalisable | Reduced; stick to the published penalties |
One consequence deserves to be stated in advance: as the available excess shrinks, the best-angle speed and the best-rate speed draw closer together, whatever the engine. They end up merging at the absolute ceiling, where only one speed and a zero rate remain. It is the same convergence that explains why at high altitude the usable speed range narrows, and why a climb chart ceases to be a choice and becomes a constraint.
To be checked in one’s own documentation, and what remains grey
Four checks made once change the reading of every subsequent flight. Knowing whether the type publishes a reference best lift-to-drag speed, and for exactly which configuration — a value given clean does not transfer to the approach configuration. Knowing how the one-engine-inoperative climb speeds are defined: as gradient or as rate, and for which segment. Knowing whether the holding speed in the operations manual is the minimum hourly consumption speed or a manoeuvre-margin compromise, because the difference is paid in fuel on a long hold. And knowing, finally, where the type’s gradient-to-rate conversion table is, and at what groundspeed it is tabulated.
The grey area does not close. The elegant ratios set out above come from an idealised polar, whereas the real polar is measured, degraded by airframe wear and distorted as soon as compressibility intervenes. The thrust and power available from an ageing airframe are not those of the manual, and nothing on board displays it. There also remains a permanent operational tension: economic speeds are not gradient speeds, and the arbitration is made in flight, on partial information, between a fuel profile and a clearance margin.
For anyone preparing a type rating or a technical interview, what is useful is not the definition. Reciting what best angle and best rate are proves nothing. What does prove something is being able to say why the best-angle speed of a jet is also its glide speed, why the best-rate speed of a turboprop is also its minimum rate-of-descent speed, what extending the flaps does to those two numbers, and how a published gradient is converted into a monitorable rate on a day with a tailwind. This reasoning is worked on in training, and limiting operational cases are compared on the forum.
The type’s certification specifications, its approved flight manual, the operator’s documentation and the published procedures prevail in all circumstances over this article, whose purpose is to set out a mechanism and not to serve as a chart or a procedure.
Questions fréquentes
Why is a jet's best climb angle speed also its glide speed?
Because both problems reduce to the same condition. In the glide, the gradient equals drag divided by weight: it is optimum where drag is least. In the climb, the gradient equals excess thrust divided by weight; since a jet’s thrust varies little with speed, that excess is also greatest where drag is least. The coincidence is therefore exact only at strictly constant thrust: because real thrust sags slightly with speed, the climb optimum lies a little below the best lift-to-drag speed.
Does a turboprop really climb better than a twinjet?
It climbs more steeply at low speed and low level, because its available thrust is greatest precisely where the jet is still short of it. The advantage bears on angle, hence on obstacle clearance and short runways. It reverses as soon as the question is sustained rate towards a high level, where the jet has an excess of power that grows with speed while propeller thrust collapses. Two different questions, two opposite answers.
At what speed does one hold to burn the least fuel?
On a jet, at the minimum-drag speed, since hourly consumption follows thrust and in level flight thrust equals drag. On a propeller aircraft, at the minimum-power speed, which is lower, since consumption follows shaft power. Published holding speeds are not these optima, however: they add a manoeuvre margin and take the configuration into account, and it is those speeds that are flown.
Do the best-angle and best-rate speeds converge with altitude?
Yes, and for both powerplants. These two speeds bracket the range in which the excess — of thrust for one, of power for the other — remains positive. Since available thrust and power decrease with density, the range narrows as one climbs. At the absolute ceiling, the two speeds merge into a single one, for a zero rate: it is the same mechanism that explains why at high altitude the conduct of the flight ceases to offer a choice of speed.
Does wind change the best-gradient speed?
Not within the air mass: the aerodynamic gradient depends only on excess thrust and weight. It does change relative to the ground, however, and it is the ground gradient that clears obstacles. In a headwind, the optimum over the ground shifts towards a slightly higher speed; in a tailwind, towards a lower one. This correction is not improvised in flight: published speeds do not include it and obstacle clearance is prepared on the ground, by converting the required gradient into a rate at the day’s groundspeed.
Why can slowing down increase drag?
Because below the minimum-drag speed, induced drag grows faster than parasite drag falls: the sum turns upwards again. One is then in a regime where any loss of speed worsens the energy deficit. On a propeller aircraft, the available thrust that rises as speed falls masks the phenomenon for a while; on a jet, nothing damps it. The way out is to give back angle of attack and accept losing altitude, never to pitch up further.


Leave a Reply
You must be logged in to post a comment.