
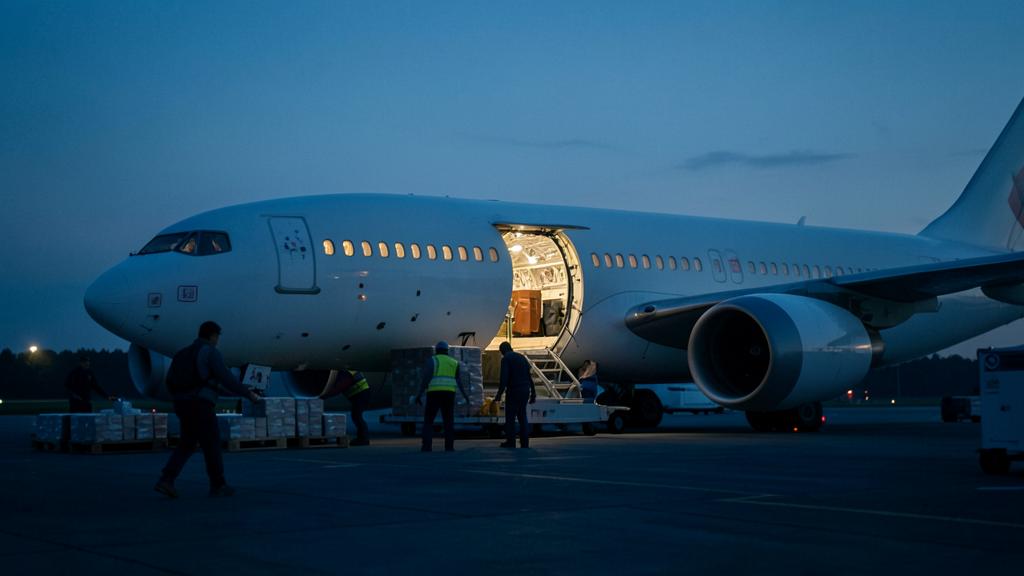
Tonne-kilometers of freight are published monthly, quoted in press releases, and discussed in strategy meetings. On the ramp, the same aircraft carries what is left after fuel, passengers, and their baggage, and this remainder changes from one rotation to another. This is how the industry figure is built, why the cargo hold of a passenger aircraft is almost never full in the sense a statistician means, and where the load plan takes over from market analysis.
What really counts in a tonne-kilometer
A tonne-kilometer of freight — FTK in the vocabulary of the ICAO, tonne-kilometers of freight or CTK in the industry series — is a tonne of freight revenue transported over one kilometer. It is generated per sector: the tonne loaded in a sector is multiplied by the distance attributed to that sector, and the products are added.
Three details in this sentence do more work than they appear to. First, the attributed distance is the route distance defined by the statistics authority, not the route actually flown by the aircraft; a long detour due to bad weather increases fuel consumption but not tonne-kilometers. Second, a shipment transiting via a hub is counted in each sector flown, so the same box can generate tonne-kilometers twice. Third, mail is sometimes included in the series and sometimes not — check which convention a number uses before comparing two sources.
Capacity is calculated in the same way. The available tonne-kilometers of freight, AFTK or ACTK, are the tonnes that an operator declares as offered, multiplied by the distance. The freight load factor is the ratio between the two. And here the ramp and the spreadsheet start to diverge, because what an operator declares as offered freight capacity is a commercial and statistical decision, not a measured quantity.
The three limits that decide traffic
On every flight, the traffic load that an aircraft can carry — passengers, their baggage, freight, and mail combined — is the lowest of the three limits, minus the dry operating mass. Which of the three limits is binding is only known once the day’s fuel figure is known, and no commercial argument moves the answer once it is known.
| Limit | What it protects | What makes it binding |
|---|---|---|
| Maximum zero fuel mass | Wing bending stress: fuel in the wing compensates for the load in the fuselage | A dense load on a short sector where little fuel is carried |
| Maximum takeoff mass, minus takeoff fuel — the structural maximum or, if lower, the performance-limited mass of the day | Structural loads at rotation, and the day’s runway, obstacle, and climb performance limits | Long sectors, hot and high airports, contaminated or shortened runways |
| Maximum landing mass, plus trip fuel, minus takeoff fuel | The landing gear and the approach and go-around performance limits | Short sectors and any flight planned to land heavy with large reserves |
Read the third line carefully, because it is the one that trips people up. Trip fuel appears with a positive sign: the fuel burned en route is a mass that will not be present during the approach, and thus buys payload against the landing limit. The unburned fuel — reserves, alternate fuel, additional fuel loaded for tankering or for a planned holding — is dead mass at both ends and takes away payload twice.
The trap. Freight capacity is not a property of the aircraft; it is a property of the flight. The same aircraft on the same route can offer several tonnes more or less on consecutive days because the alternate has changed, the wind has shifted, or the load controller was given a higher taxi fuel figure. Any capacity number given without a sector, a fuel plan, and a passenger forecast behind it is a marketing number.
The amount of freight an aircraft can carry depends on three limits: how much the wings can handle, how much the runway and climb performance allow, and how much the landing gear can take. Fuel changes these limits every day, so the actual freight capacity isn’t fixed—it’s a moving target.
An Airbus A321LR flying from Paris to New York on a hot summer day might see its takeoff weight limited by 5 tonnes; on a full-fuel transatlantic flight, that comes straight out of the payload. On a cooler day, the same flight could carry several tonnes more freight. The difference comes from the performance limits, not from the demand.
Fuel consumes freight capacity first
On a long sector, the limiting case is almost always the takeoff mass. Every kilogram of fuel above the minimum is a kilogram of freight that cannot be sold, and the trade-off is almost one-to-one at the margin. Three ordinary decisions consume payload without anyone calling it a freight decision: a distant alternate imposed by the destination forecast, additional fuel loaded against an expected holding, and tankering when fuel is expensive at the destination.
Tankering is the clearest case of a commercial trade-off made against freight capacity. It is arithmetically solid when the fuel price differential is large and the sector is short, and is a direct trade-off: cheaper fuel bought now takes up mass that would otherwise be payload. If the freight market is strong, the same calculation is reversed. Operators who do both calculations in the same system make better decisions than those where fuel and freight report to different departments.
Passengers and their luggage go first, freight takes what remains
Commercially, the passenger cabin is sold before the cargo hold, and its contents travel by contract. Checked baggage is loaded before freight, and its mass is estimated, not weighed, in most operations: the crews and the load controllers work with standard mass values approved for the operator, with the option — and sometimes the obligation — to weigh if the population deviates from the assumption behind it.
The consequence for freight is direct. A full holiday aircraft in peak season with heavy checked baggage can leave almost nothing sellable in the cargo hold of an aircraft that on paper offers significant freight capacity. The same aircraft flying a route with more business traffic midweek, with a lighter cabin and lighter baggage, frees up several tonnes. Freight capacity thus has the seasonality of the passenger network, which is not the seasonality of the freight market — a structural discrepancy that no revenue management erases.
Mass, volume, and the density the tariff assumes
The second reason why a cargo hold is rarely full in both senses at the same time is density. Air freight is charged on a chargeable weight, which is the greater of the actual mass and a volumetric mass derived from the shipment’s dimensions. The widespread tariff convention treats about six thousand cubic centimeters as one kilogram — in the order of one hundred and sixty kilograms per cubic meter. This number is a commercial convention set by the carrier’s tariffs, not a regulatory value, and exists precisely because a cargo hold fills volumetrically long before it fills by mass.
Express packages, loose clothing, and e-commerce boxes sit far below the convention: the cargo hold is volumetrically full while the aircraft is far from a mass limit. Machine components, printed matter, and battery shipments sit above it: a small stack reaches a position limit while there is still deck space left. Load controllers spend the day mediating between the two, and a good freight sales department builds a mixed load precisely to balance one against the other.
What a freight position accepts and what it does not
Under the aircraft’s mass limits are local ones. Each compartment has a maximum load; groups of compartments have cumulative limits; and within a compartment, the structure sets limits per unit of length and per unit of area. A unit load device carries its own maximum gross mass, which is a property of the unit’s certification and does not increase because the aircraft position could take more.
| Restriction | Where it is written | Typical form in which it is applied |
|---|---|---|
| Compartment and cumulative compartment limits | Aircraft flight manual and the operator’s mass and balance manual | A rear cargo hold reaches its limit while the forward cargo hold is empty |
| Linear load and load per unit area | The same, expressed per meter of cargo hold length and per unit area of the floor | A dense, small footprint that no position accepts without a spreader |
| Gross mass and tare mass of the unit load device | The unit’s own label and the operations manual | The tare mass quietly consumes payload in a containerized aircraft |
| Center of gravity envelope | Loading instruction and the trim sheet | The load must be redistributed, or a position left empty, to keep the trim within limits |
| Segregation and special loading rules | Standards for dangerous goods, rules for handling live animals and perishable goods | Two acceptable shipments that cannot travel in the same compartment |
The center of gravity deserves its own line because it turns a mass problem into a geometric problem. A trim that does not close is solved by moving the load forward or aft, and sometimes by not carrying a shipment that would otherwise fit. Aircraft with a wide loading range absorb this quietly; those with a narrow envelope or a heavily forward-loaded cabin regularly lose sellable tonnes to trim.
The right reflex. If a shipment for a flight with visibly empty freight space is rejected, ask which of the five previous restrictions was binding before assuming an error. Volumetrically full, position-limited, trim-limited, and mass-limited are four different rejections, and only one of them is solved with a larger aircraft.
Special freight reduces usable freight space before anything is loaded
Dangerous goods, live animals, and temperature-controlled shipments each have requirements for segregation and handling that reduce usable capacity in ways a volume model does not see. Two shipments, each acceptable individually, may be prohibited in the same compartment; a temperature-controlled unit may require a specific position and approval for power or dry ice; an animal shipment limits what can travel around and above it.
The result is that a freight hold with, for example, five positions can effectively offer three sellable ones in a flight carrying a demanding shipment. This is completely normal, completely correct, and completely invisible in a capacity statistic that counts offered tonnes against a theoretical maximum.
Reading the published numbers against your own day
None of this makes the statistics wrong. It makes them a description of a market rather than a description of an aircraft. Used correctly, the monthly series tells you about direction, seasonality, and the balance between belly capacity and freighter capacity; it does not tell you what you can sell in the next rotation.
| Number | What it measures | What it does not show |
|---|---|---|
| Freight or cargo tonne-kilometers | Revenue tonnes actually flown, weighted by distance | Whether the tonne was dense or voluminous and whether it was paid for |
| Available tonne-kilometers | Capacity that the operator declares as offered | Positions limited by fuel, trimming, and segregation on the day |
| Freight load factor | The ratio of the two previous numbers | Volumetric saturation, which in freight loading is often reached first |
| Share of the freight hold in total capacity | How much freight capacity travels under the passengers | That this share follows the passenger plan, not freight demand |
| Performance per tonne-kilometer | Revenue intensity of the tonne transported | Costs for handling, ground, and freight load units that lie outside the metric |
Two practical habits follow. Compare load factors only within a comparable network: a short-haul operation with narrow-body aircraft and a long-haul operation with wide-body aircraft produce numbers that are not of the same kind. And when freight capacity returns after a disruption, expect it to return with the passenger plan — because those are the aircraft that carry it.
Where the operational answer lives
The tools of the load controller already contain everything discussed here. The mass and balance system holds the three limits, the compartment and load values, and the center of gravity envelope; the flight plan holds the fuel figure that will move the takeoff limit; the passenger forecast holds the cabin mass. What is often missing is the loop that puts a freight sales decision in the same picture early enough to matter.
Operators who do this well share three features. They publish a realistic figure of sellable freight per rotation instead of a fleet average. They give the freight department visibility into fuel decisions before the fuel is loaded, not after. And they treat a rejected shipment as data on which restriction is most often binding on this route, rather than as a one-off. How different operators structure this loop is a recurring topic in the ramp and load control community in the FL330 forums.
The market number and the load plan answer different questions. Confusing them costs money in both directions: sold capacity that cannot be flown, and flown capacity that was never offered because no one recalculated it after the fuel plan changed.


Leave a Reply
You must be logged in to post a comment.