
A safety case concludes at 2.7 × 10⁻¹⁰ per flight hour for the total loss of a function, and all that remains is to approve it. The calculation is correct; yet it means nothing until three questions have a written answer: of what budget is this number a share, what verification interval does it assume, what independence does it take for granted? The decades required by certification come from neither a measurement nor a statistic, but from a division whose terms must be known to understand what the figure covers — and above all what it does not cover.
The severity classification does not describe the failure, but what it does to the aircraft
Everything starts with the functional hazard assessment, which is carried out before any architecture exists. It lists the aircraft’s functions, postulates for each the total loss, the partial loss and the erroneous operation — the insidious failure, the one that produces a wrong result without announcing itself — then qualifies the effect obtained on the aircraft, its occupants and the crew. The component is never in question: the classification bears on the consequence.
Five degrees structure the scale. No safety effect, when neither capabilities nor margins are degraded. Minor, when the reduction in margin is slight and the workload only slightly increased. Major, when the reduction is significant and the workload markedly heavier, with occupant discomfort possibly extending to injuries. Hazardous, when the degradation is such that the crew can no longer be assumed to perform its tasks accurately, with serious or fatal injuries to a small number of occupants. Catastrophic, when the condition results in multiple fatalities, generally with the loss of the aircraft.
Two practical consequences follow. First, the same failure changes class depending on the phase: harmless in cruise, a loss of function can become hazardous during rotation or on a low-visibility final approach. The analysis therefore does not produce a list of failures, but a list of failure conditions, each attached to a moment in the flight, a configuration and an environment.
Second, this classification is the only truly human judgment in the chain; everything that follows is merely arithmetic conditioned by it. Moving a condition by one notch changes the target by a factor of a hundred and the development assurance level by one letter — in practice, an architecture, a verification plan and a schedule. Discussions with the authority therefore concentrate there, not on the third decimal place of a failure rate.
The classification is about consequences, not failures. A function’s impact on the aircraft determines its safety class, not the failure itself. This decision sets the entire safety budget for that function.
On an Airbus A320, a hydraulic system failure might be classified as “Major” during cruise (increased workload) but “Hazardous” during landing (loss of control authority). This dual classification means different safety targets apply depending on flight phase.
Where the required decades come from
The question comes up in every design office: why 10⁻⁹ and not 10⁻⁸? The original reasoning is public, it is arithmetic, and it fits in two divisions.
First term, an observation: the accident rate observed on transport aircraft at the time these rules were set, on the order of one accident per million flight hours. This figure was not a target; the intent was not to let it degrade as onboard systems took over functions that had until then been mechanical or human.
Second term, an allocation key: the share of these accidents attributable to onboard-system failures, on the order of one tenth. The rest fell to flight handling, weather, terrain, powerplant, structure — other approaches, with their own requirements. The budget left to the systems is therefore set at roughly 10⁻⁷ per flight hour.
Third term, a counting assumption: how many catastrophic failure conditions does a transport aircraft comprise? The order of a hundred was adopted. Spreading 10⁻⁷ across a hundred conditions gives 10⁻⁹ per flight hour for a single condition taken in isolation. That is the entire origin of the most-quoted figure in certification.
The rest of the scale is built by continuity of the same principle: the less severe the effect, the more frequent it is allowed to be. Each severity notch relaxes the target by two decades — 10⁻⁷ for a hazardous condition, 10⁻⁵ for a major one, 10⁻³ for a minor one. None of these three numbers derives from an accident rate: they simply extend an allocation rule, nothing more.
The hundred-conditions assumption deserves a pause, since a modern aircraft lists far more than that. Yet it is not renegotiated: the remedy lies in the conservatism accumulated at every step — an unfavourable reference flight, rates taken from recognised databases rather than measured on the fleet, no credit for an unjustified crew action. The margin is not in the target, it is in how it is verified. Applied to other fleets, the same reasoning yields other results: the certification specifications for light aircraft and rotorcraft adjust these targets according to aircraft class and type of operation.
The 10⁻⁹ target comes from dividing the total accident budget (10⁻⁶) by the systems’ share (1/10) and then by the number of critical conditions (100). It’s a mathematical allocation, not a measured rate.
On a Boeing 787, the “loss of all flight control computers” might be classified as catastrophic. If the aircraft has 120 such conditions, the budget for each would be 10⁻⁷ / 120 = 8.3 × 10⁻⁹ per flight hour.
A staircase, and a second axis the figure does not carry
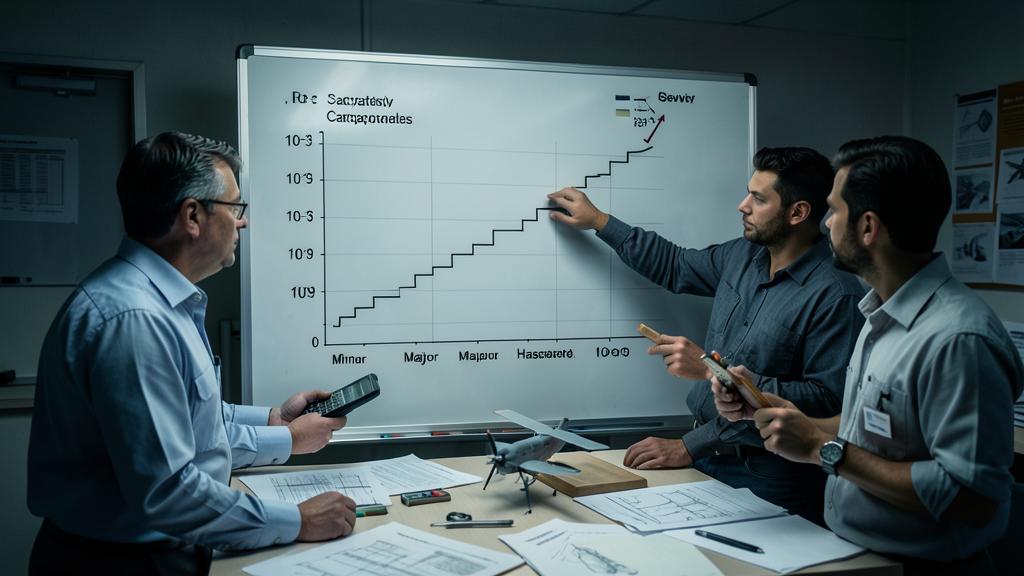
Represented graphically, the rule takes the shape of a staircase: at each severity notch, the accepted probability drops by two steps. The area below the line is acceptable, the area above it is not. It is the one object of systems certification that everyone has seen at least once, and one of the most poorly read: it does not describe a risk, it allocates a budget.
Alongside the quantitative target, for the most severe class, a purely qualitative requirement is added: no single failure shall lead to a catastrophic condition, whatever its calculated probability. A component whose failure rate could be shown to be far below the target would not be enough; the architecture must tolerate its loss. A catastrophic condition is therefore never demonstrated by a number alone.
And there is a second axis, one the figure does not carry at all. A failure rate describes hardware that wears, drifts or breaks; it does not describe a specification or coding error. Such an error is present from entry into service, it does not occur at random, and above all it strikes every identical channel at once: two computers running the same software err together, at the same millisecond, on the same input. Multiplying their probabilities makes no sense.
Hence a second scale, fed by the same classification: the development assurance levels, from A for catastrophic to E for no-effect. Nothing is demonstrated there by calculation; a rigour of process is imposed instead — requirements traced through to the code and the tests, reviews, independence of verification, configuration management. The level is not a disguised probability: it is a quantity of evidence.
| Severity of the condition | Probability qualifier | Accepted order of magnitude, per flight hour | Development assurance level |
|---|---|---|---|
| No safety effect | not applicable | no target | E |
| Minor | probable | 10⁻³ | D |
| Major | remote | 10⁻⁵ | C |
| Hazardous | extremely remote | 10⁻⁷ | B |
| Catastrophic | extremely improbable | 10⁻⁹, and no single failure sufficient | A |
| Criterion | Random hardware failure | Development error |
|---|---|---|
| Origin | wear, drift, manufacturing defect | specification, design, coding, integration |
| Behaviour over time | roughly constant rate over the service life | present from entry into service, revealed only by the triggering case |
| Effect of identical redundancy | divides the probability | none: the channels fail together |
| Demonstrated by | fault tree, rates from recognised databases, testing | process rigour, traceability, independent verification |
| What the quantitative target says about it | everything | nothing |
The budget is allocated before it is verified
The preliminary system safety assessment works top-down: starting from the condition classified at aircraft level, it builds the fault tree of the intended architecture and allocates each contributor a share of the budget. That share flows down into the specifications — a supplier receives a numerical target the way it receives a maximum mass, and commits to it. The system safety assessment, for its part, works bottom-up on the architecture as actually built and verifies that the sum holds. In between, years and trade-offs.
Two conventions condition the entire calculation, and they travel badly. The first is the time base: the target is expressed as an average probability per flight hour, over a reference flight of conventional duration. Two operators of the same type, one flying forty-five-minute sectors, the other nine-hour routes, do not have the same per-flight exposure to phase-related conditions. A certification figure cannot be transposed without redoing the arithmetic.
The second is the exposure time of latent failures. A dormant failure — a standby channel out of service, an inhibited protection, a sensor frozen on its last plausible value — is revealed only at the next check. Its average unavailability is roughly its failure rate multiplied by half the interval between two checks: the probability of a combination containing a latent term is therefore proportional to that interval. This is how maintenance tasks arising from certification come about: they do not come from reliability analysis, they are a term in a safety demonstration.
The trap. In the maintenance programme, a task whose interval originates from a safety demonstration looks like any other. It is not: it is a term in a fault tree. Lengthening it by a factor of three — something the evolution of a programme routinely and rightly does for tasks arising from maintenance analysis — multiplies by three the demonstrated probability of the condition to which it contributes, with no warning light coming on. It is one of the rare cases where operations alone can invalidate a certification conclusion.
Safety targets are allocated before verification. Maintenance intervals for latent failures are part of the safety math, not just reliability. Changing them affects the demonstrated safety level.
On an A330, a hydraulic system check interval might be set at 1,000 flight hours to keep the probability of a latent failure below 10⁻⁹. Extending this to 3,000 hours (without justification) would triple the actual risk.
Redundancy only multiplies what is independent
The product of probabilities applies only to independent events. Everyone can recite that sentence, yet it gets lost quickly in a tree of three hundred gates. A deliberately round arithmetic example shows this: three identical channels, each at 10⁻⁴ per hour, would give 10⁻¹² if they were perfectly independent; let just one hundredth of their failures share a common cause, and the simultaneous loss of all three no longer drops below 10⁻⁶. Six decades lost, without a single line of the calculation being wrong.
Hence the three analyses that accompany every serious tree and that, themselves, produce no number. The zonal safety analysis examines what is physically shared by channels supposedly kept separate: a common bay, a common wiring run, a common floor. The particular risks analysis reviews the hazards that strike everything in their path: rotor burst, tyre debris, bird strike, lightning, fire, fluid leak. The common mode analysis tracks down what is identical without being visible: the same batch, the same software, the same calibration, the same maintenance action applied to both channels on the same day, the same wrong assumption in both specifications.
The operational conclusion is clear: beyond two or three channels, it is no longer redundancy that gains decades, it is dissimilarity and segregation. A fourth identical computer in the same bay, loaded with the same software, changes almost nothing in the result — something the product of probabilities, by itself, does not tell you.
The right reflex. Faced with any probability figure, ask three questions before discussing its value. Of which failure condition is it the probability, and to which severity class is that condition attached? On what time base is it expressed, with what reference flight duration and what exposure intervals for latent terms? What independence does it assume, and where is the analysis that demonstrates it written down? A figure that survives all three can be discussed. A figure with no answer to any of them is nothing more than a product of orders of magnitude.
Redundancy only works if failures are independent. Common causes create a “floor” that limits how much redundancy helps. After 2-3 channels, dissimilarity matters more than more identical components.
On an A380, the flight control computers are triplexed (3 channels). If 1% of failures are common cause, the actual probability is 3 × 10⁻⁶ (not 10⁻¹² as naive math would suggest). Adding a 4th identical channel barely improves this.
What the figure does not say, and what people make it say
It is not a frequency prediction. No fleet will ever accumulate the hours needed to verify a target of 10⁻⁹: a thousand aircraft flying three thousand hours a year total three million hours annually, and it would take on the order of three centuries to reach a billion hours. The target is, by construction, unverifiable by observation. That is precisely its status: a design criterion, not a measurement.
The time bases do not add up. A probability per flight hour, a probability per flight and a probability referred to a phase can only be compared after explicit conversion. Many inconsistencies flagged in a document review come from there, not from a modelling error.
It covers only random hardware failures, within the certified architecture. A design error falls on the other axis, a production-organisation manufacturing deviation, an installation or maintenance error over the aircraft’s life, elsewhere still.
It assumes the aircraft is complete. Departing with equipment inoperative under the minimum equipment list does not rest on the certification figure: that tolerance is the subject of its own analysis, which attaches to the deferred repair a time limit and, often, procedures intended to restore part of the lost protection. The remarks accompanying an item on the list are not formalities: they are the compensation for a depleted budget.
It is not an operational risk indicator, and it does not sum into an aircraft safety level. The risk matrix of a safety management system classifies observed events against a known exposure: importing a certification target into it mixes a design allocation with an operational measurement. As for summing the targets of every condition, that gives the budget, not the result achieved — which is most often considerably better, without anyone being able to say by how much.
What to go check in your own documentation
For a maintenance manager, one question deserves to be asked: does the maintenance programme distinguish, in its structure and not merely in a footnote, between tasks whose interval comes from a safety demonstration and those that come from maintenance analysis? If the process for evolving intervals does not treat them separately, the trap described above is already in place.
For a crew, the immediate payoff lies in the procedures that accompany minimum equipment list items: they stop being an administrative constraint the moment they are read for what they are, the exact counterpart of a missing channel. For a safety manager, the essential task is to prevent contamination of the vocabulary: « extremely improbable » has a precise meaning and an associated value, and using it in a report to mean « we did not expect that » disarms the phrase exactly where it matters.
For anyone preparing a type rating or an airworthiness post, the entry point is not the fault tree but the list of failure conditions for the type one already knows: their wording alone teaches in an hour what the trees do not teach in a month. What remains is a grey area no one claims to have closed — the classification itself, and the credit given to crew action. That is where the analyses of two equally competent organisations diverge the most, and where decades are won or lost without any calculation being at fault. The FL330 technical forum and the FL330 training programmes return to this regularly.
The certification specifications applicable to the type, the approved safety case and the operator’s approved documentation take precedence over this article, whose purpose is to shed light on a mechanism, not to substitute for it.
Questions fréquentes
Why is the target set at 10⁻⁹ per flight hour and not some other value?
Because it results from two successive divisions, not from a measurement. It starts from the accident rate historically observed on transport aircraft, on the order of one per million flight hours, keeps the share attributable to onboard systems, on the order of one tenth, which leaves roughly 10⁻⁷ per flight hour for all systems combined. This envelope is then spread across the order of a hundred catastrophic failure conditions identified per aircraft, hence 10⁻⁹ for a single condition taken in isolation.
Can one verify after the fact that a target of 10⁻⁹ is actually met in service?
No, and that is not the intent. A fleet of a thousand aircraft flying three thousand hours a year accumulates three million hours annually: it would take on the order of three centuries to reach the billion hours needed to observe the event once. The target is a design criterion verified on an architecture and a model, not a statistical forecast that can be checked against in-service returns.
Do these targets cover design errors and software defects?
Not at all. A failure rate describes hardware that wears, drifts or breaks; a specification or coding error is present from entry into service and strikes every identical channel at once, which makes multiplying probabilities meaningless. This risk is handled on a second axis, that of development assurance levels, allocated from the same severity classification and satisfied by process rigour: traced requirements, reviews, independent verification, configuration management.
What becomes of the target when departing with equipment inoperative under the minimum equipment list?
The certification figure assumes the aircraft is complete, so it does not cover this situation. The tolerance to depart rests on its own analysis, which sets a deferred repair time limit and, very often, operational or maintenance procedures associated with the item. These remarks are not administrative: they are the explicit compensation for the protection withdrawn, calculated for the limited duration of the deferral.
Are three redundant channels enough to reach a catastrophic-level target?
Only if the independence of the three channels is demonstrated, and it is that demonstration that decides, not the product of the rates. Even a small fraction of common-cause failures sets a floor that redundancy no longer crosses: three channels at 10⁻⁴ per hour compute to 10⁻¹², but if one hundredth of their failures is shared, the real result does not drop below 10⁻⁶. Beyond two or three channels, it is dissimilarity and physical segregation that gain decades, not the number of channels.
Can these targets be reused in the risk matrix of the safety management system?
It is better to refrain. The risk matrix of a safety management system classifies observed events against a known exposure, with identified barriers and usable operational feedback; the certification target is a design allocation attached to a specific failure condition. Mixing the two produces meaningless comparisons and weakens the vocabulary, particularly the phrase “extremely improbable”, which has an associated value and loses all usefulness if used to mean that an event came as a surprise.


Leave a Reply
You must be logged in to post a comment.