
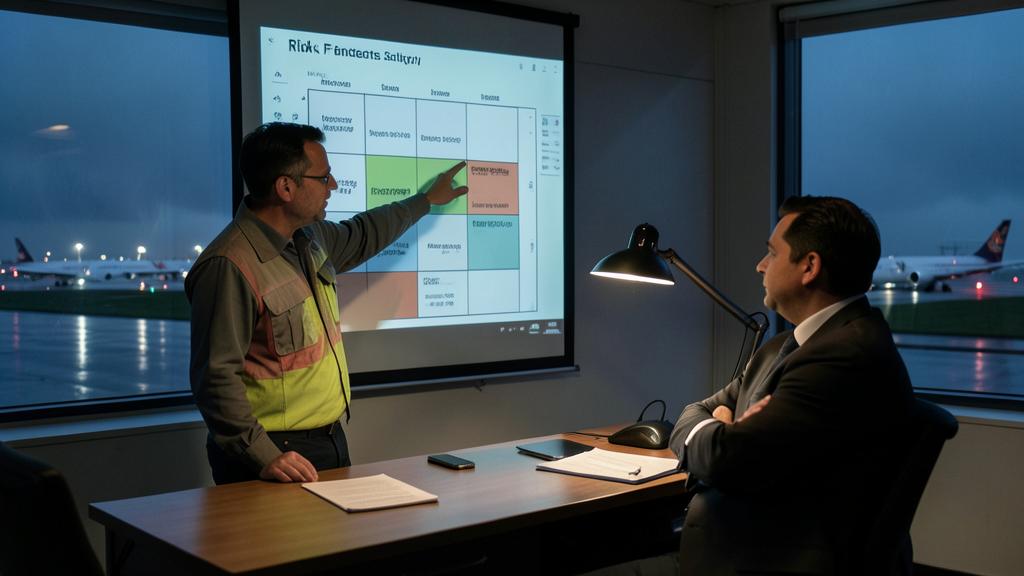
Every safety manager has sat in this meeting. The proposal is technically sound, the cost is real and immediate, and the outcome it is meant to prevent has never once occurred in the operator’s history. The finance director asks the only question that interests him: what is the probability? Answering with a number you cannot defend is the fastest way to lose that argument — and the next three, because a figure that collapses under questioning discredits the whole safety register. There is a stronger construction available, and it does not require inventing anything. It requires showing which barrier is missing, what is holding the outcome back instead, and what the organisation is actually deciding when it says no.
An unbroken record is data about exposure, not about safety
Start by disarming the argument on both sides, because it is used in both directions. Take a fleet of fifteen aeroplanes flying some twenty thousand sectors a year. Suppose the outcome under discussion — a runway excursion on a contaminated surface, a controlled flight into terrain during a non-precision approach, a fuel state declared as an emergency — has a true rate somewhere in the region of one per ten million sectors. That operation would expect to see it about once every five centuries. Having never seen it is exactly what such a rate predicts. It is also what a rate ten times worse predicts, over the few decades any operator has actually flown. The operator’s own outcome history cannot separate those two worlds, and no amount of rhetorical pressure will make it do so.
There is a second problem with the history: it was earned under different exposure. Those clean years were flown with a different fleet, different destinations, a different day/night ratio, different rotation pressure and very probably a different runway surface. When exposure changes, the past stops being a guide before anyone notices. A safety case that starts by establishing what has changed in the denominator is already halfway to being credible.
There is a second problem with the history: it was earned under different exposure. Those clean years were flown with a different fleet, different destinations, a different day/night ratio, different rotation pressure and very probably a different runway surface. When exposure changes, the past stops being a guide before anyone notices. A safety case that starts by establishing what has changed in the denominator is already halfway to being credible.
There is a second problem with the historical record: it was earned under a different exposure. Those clean years were flown with a different fleet, different destinations, a different night-to-day ratio, different turnaround pressure and quite possibly a different runway surface. When exposure changes, the past stops being a guide before anyone notices. A safety case that begins by establishing what changed in the denominator is already halfway to being credible.
If something bad has never happened, it doesn’t mean it’s safe. It just means it’s rare. The real question is whether the things that stop it from happening are still working.
An airline with 15 aircraft flying 20,000 sectors a year has never had a runway excursion in 11 years. But if the real risk is 1 in 10 million, they’d expect one every 500 years. Their clean record doesn’t prove safety—it just proves they haven’t been flying long enough to see the worst-case scenario.
The invented number, and how it fails
Most safety management systems run a risk matrix: a likelihood axis crossed with a severity axis, producing a colour. The likelihood axis is labelled in words, with numeric anchors attached to each word. The mechanism is sound for hazards that occur often enough to be counted, and systematically abused for the ones that do not.
The abuse has a recognisable shape. The analyst knows which colour will get the proposal funded, and the likelihood cell is selected to produce that colour. Nobody quite lies; the reasoning runs backwards. Once anyone numerate on the other side of the table notices — and they will, because the same hazard was scored differently in an earlier register — every entry becomes negotiable. One reverse-engineered score is paid for over years.
The abuse has a recognisable shape. The analyst knows which colour will get the proposal funded, and the likelihood cell is selected to produce that colour. Nobody quite lies; the reasoning runs backwards. Once anyone numerate on the other side of the table notices — and they will, because the same hazard was scored differently in an earlier register — every entry becomes negotiable. One reverse-engineered score is paid for over years.
Borrowed industry rates fail differently. A published global rate for an event type averages across fleets, operating regimes and reporting cultures that have nothing to do with your operation, and the person you are trying to convince will say so, correctly.
The matrix has a third weakness worth stating out loud: it compresses. Two hazards in the same cell can differ by two orders of magnitude in expected harm, and the severity axis is normally truncated at the top. A matrix is a triage tool for sorting a long list; it was never a costing instrument, and using it as one is what forces people to invent numbers.
| What you present | What the decision-maker hears | Where it breaks |
|---|---|---|
| A likelihood figure derived from the operator’s own history | A precise-sounding number | The history is too short to support any figure; one competent question ends it |
| A published industry rate for the event type | An authoritative external source | Different fleets, regimes and reporting cultures; not transferable to one operator |
| An accident at another operator, described in detail | An emotional appeal | Invites the answer “we are not them”, and that answer is unfalsifiable |
| An inventory of the barriers between routine operation and the outcome, with their current condition | A factual statement about today | Only if the inventory is wrong — and it can be checked, which is the point |
| A trend in precursor events drawn from the operator’s own flight data and reports | Something happening now, in this operation | Only if the precursor is not on the same causal path as the outcome |
What replaces probability: the state of the barriers
The construction that survives scrutiny is barrier-based. Lay out the causal path: the threat, the top event you do not want, and the consequences that follow it. On the left-hand side sit the barriers that prevent the top event; on the right, the barriers that limit its consequences once it has occurred. This is the bow-tie, and its value here is not the drawing. Its value is that it lets you make three claims that are entirely verifiable without any probability at all.
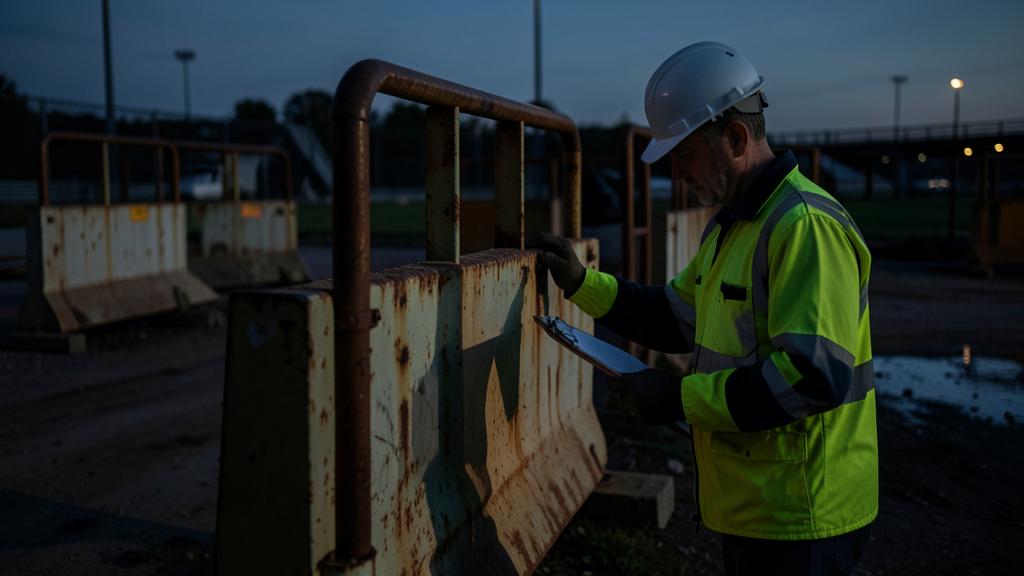
The first claim is a count: how many barriers stand between normal operation and the outcome. The second is about independence: whether those barriers can fail together. A crew procedure, a crew checklist item and a crew cross-check are frequently presented as three barriers when they are one barrier — the same people, under the same workload, with the same training. A common-mode dependency reduces a comfortable-looking defence in depth to a single line, and demonstrating that is far more persuasive than any number. The third claim is about condition: whether each barrier is actually in the state the manual assumes.
All three are auditable, and all three can be evidenced from material the operator already holds — flight data monitoring exceedances, occurrence reports, audit findings, deferred defects under the minimum equipment list, and training records showing which recurrent items were waived. None of it requires a new study.
The strongest sentence available to a safety manager is not “the probability is X”. It is: at this aerodrome, in this configuration, one barrier now stands between the routine condition and the outcome, and here is its state. That is factual, checkable, and impossible to answer with “we have never had one”.
| Barrier function | Question it answers | Evidence available inside the operator |
|---|---|---|
| Elimination or design | Can the exposure be removed rather than managed? | Route and aerodrome selection files, fleet configuration decisions, dispatch restrictions |
| Prevention by procedure or training | Is the crew or technician told, and are they trained and able to comply? | Manual revisions, recurrent training records, line checks, competence assessments |
| Detection and alerting | Would the drift be noticed before the top event? | Flight data monitoring parameters and exceedance rates, alerting fit status, inhibit logic |
| Recovery | Once it starts, is there a practised way back? | Simulator session content, drill currency, air traffic and ground procedures |
| Consequence limitation | If it happens, how bad is the worst case allowed to get? | Cabin safety equipment and drills, rescue and firefighting category, containment and separation measures |
Precursors are useful, but they are not a pyramid
Precursor data is the closest thing to evidence the operator owns, and it is routinely misused. The old accident triangle — many minor events at the base, one catastrophe at the apex, in fixed proportion — does not transfer to low-frequency, high-consequence outcomes. Other high-hazard industries learnt this expensively: organisations with excellent personal-injury statistics have suffered catastrophic process failures, because slips and cuts and the integrity of a containment system are not on the same causal path and do not share barriers.
The discipline is simple. A precursor counts only if it sits on the bow-tie you are arguing about: the same threat, the same top event, one barrier further back. A rising rate of unstable approaches continued to a landing is a genuine precursor of a runway excursion, because the barrier that failed is the one you are asking to reinforce. A good lost-time-injury rate is not evidence about that excursion, and quoting it as reassurance is a mistake repeated in board packs across the industry.
The trap. A precursor trend is only as good as the reporting that produces it. A falling occurrence rate after a management change is at least as likely to mean people have stopped reporting as it is to mean the operation improved. Before presenting a downward trend as success, check whether report volume fell across all categories at the same time — that pattern is a reporting signal, not a safety signal.
Costing the barrier rather than costing the accident
The instinctive move is to multiply a probability by a loss and compare it to the price. That reintroduces exactly the number you cannot defend, and it usually loses anyway: a small probability multiplied by a large loss produces a figure smaller than the invoice. Turn the comparison around and cost what is known.
The full cost of the barrier is more than the purchase order: the equipment, the training to use it, the maintenance to keep it working, the workload it adds to a crew or a shift, and — a step almost always skipped — the new failure modes it introduces. A barrier that produces nuisance alerts will be inhibited within a year, and an inhibited barrier is money spent on nothing.
Against that, put the cost of the arrangement currently standing in its place. Where a barrier is absent, something is usually compensating: extra crew, a manual verification, an operational restriction, a payload penalty, an aircraft dispatched with a deferred defect, or a supervisor doing a check on top of their own job. That cost is on the books today and can be quantified without any probability at all. It is frequently larger than anyone realised, and it is the number that changes minds.
Then state the ceiling, once, without theatre: what the worst credible outcome does to the certificate, the fleet, the insurance position and the operating permissions. The ceiling needs no probability attached to be a legitimate input into a decision about how much uncertainty the organisation will carry.
The right reflex. Ask for the reversible version first. A barrier trialled on one base, one fleet or one route for six months, with a measure defined in advance and a stated point at which it is abandoned, is far cheaper to be wrong about than a fleet-wide commitment — and it converts an argument about probability into a question the operation can answer with data it will generate itself.
What you are actually asking the accountable manager
Under any management system built on the ICAO framework, the accountable manager holds authority over resources. The safety function proposes and analyses; it does not decide. That division determines what document you should be writing. You are not writing a purchase request. You are writing a risk acceptance record, and its subject is the residual risk the organisation is prepared to hold.
Written that way, the paper stops being an advocate’s brief and becomes a neutral statement of position: here is the exposure, here are the barriers, here is the one that is missing, here is what it costs, here is what remains if it is not funded. It is not a threat but the correct allocation of a decision the safety function is not empowered to make.
| The question | An answer that holds | An answer that loses the room |
|---|---|---|
| What is the probability? | Too rare for our data to estimate; here is what we can measure instead — the barriers and their condition | A figure with three significant digits |
| Why now, if nothing has happened? | Because the exposure changed: new destinations, new fit, new pressure on turnarounds | Because we have been lucky |
| Does anyone else do this? | Here is who does, and here is what changed for them | Everyone does — usually untrue and easily checked |
| Can we do it later? | Yes, and here is the trigger that would make later unacceptable | No, without saying why not |
| Can we do half of it? | Yes: here is the partial barrier and what it does and does not cover | Half is pointless — almost never true |
When the answer is no
A refusal is not the end of a safety case; it is a change to it. Four things should follow, none of them adversarial.
- Ask for the partial barrier: most proposals decompose, and a partial barrier honestly described is worth more than a full one indefinitely postponed.
- Define the trigger that reopens the file — a precursor rate crossing a stated threshold, a new destination or type, a specific audit finding — because agreeing it in advance, while nobody is under pressure, is far easier than reopening the argument later.
- Set a review date in the calendar of the person who declined, not only in yours.
- Record the compensating measures genuinely in place, with the resource that makes them possible: a verification nobody has time to perform is not a barrier, and writing it down as one is how a register becomes fiction.
What does not work is escalation as a tactic. Taking a funding dispute to the authority as leverage buys one decision and costs the working relationship every subsequent decision depends on.
Barriers decay, and the file has to say so
The last part of the argument is the one that makes the next argument possible. A barrier funded three years ago is not a barrier today unless somebody has maintained it. Training lapses. Alerts get inhibited because they cry wolf. A checklist item becomes a reflex with no content behind it. Equipment is fitted to part of the fleet and quietly not to the rest. Barrier decay is the normal state of affairs, and it is invisible unless it is measured.
For each barrier that matters, define two or three observable indicators and review them on a fixed cycle: currency of the relevant training, inhibit or override rate, exceedance rate on the controlled parameter, fit status across the fleet. The payoff is underrated. An operator that can show the last barrier it paid for is still working has a materially easier conversation the next time it asks for one — a point argued continuously on the FL330 professional forums, where the same case is being made in a dozen operations at once.
None of this makes the decision easy. It makes it honest, which is more durable. The operator that funds a barrier without a fabricated probability has bought something it can defend to an auditor, an insurer and, in the worst case, an investigator — and the one that declines has at least declined knowing what it declined.


Leave a Reply
You must be logged in to post a comment.