
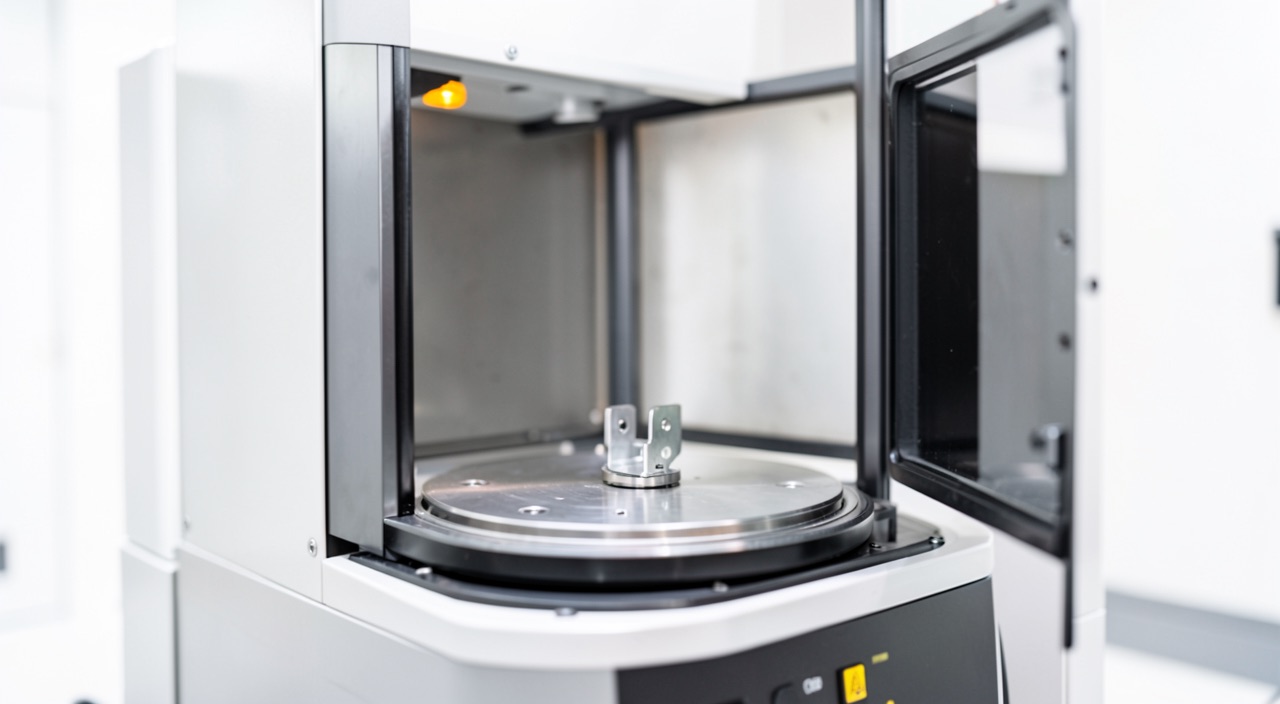
A Ti-6Al-4V fitting emerges from the powder bed fusion machine, goes through tomography, and the report comes back: « no recordable indication. » The real question isn’t the report, but its conditions: at the voxel size used, what could the system detect? On a full-scale part, the smallest reliable defect often exceeds the defect size governing fatigue performance. It’s this gap, and how the industry bridges it through process control, that needs to be understood.
Three types of porosity that don’t look alike
Porosity in the singular is already an analytical error. Powder bed fusion produces three families of internal defects, with distinct mechanisms and opposite radiographic signatures. The gas pore comes from trapped atomization gas in the powder grains or dissolved gas that doesn’t have time to escape the melt pool: it is spherical, small, and dispersed throughout the volume. The keyhole pore is born from excessive linear energy: the melt pool transitions to a vaporization regime, a vapor capillary forms, becomes unstable, and collapses, trapping bubbles deep, often aligned along overheated paths. Incomplete fusion, finally, proceeds from the opposite mechanism: insufficient overlap between beads or layers leaves areas never remelted, sometimes loaded with unconsolidated powder. Its morphology is flat, irregular, and oriented in the plane of the layers.
La tomographie ne voit pas tous les défauts. Certains sont trop petits, d’autres trop plats. Les défauts les plus dangereux (comme les zones mal fusionnées) sont souvent ceux qu’on détecte le moins bien.
Sur un composant en Ti-6Al-4V de 30 cm de long, une tomographie avec des voxels de 200 microns peut manquer une zone de fusion incomplète de 100 microns d’épaisseur, même si elle mesure 5 mm de long. Cette zone pourrait réduire la durée de vie en fatigue de 30%.
This geometry isn’t just a metallurgist’s detail: it governs both harmfulness and detectability, and the two hierarchies are inverted. The defect that behaves most like a crack—the thin, closed, sharp-edged incomplete fusion—is also the one that offers the least grip to imaging.
| Famille | Process origin | Morphologie | Tomography signature | Harmfulness in fatigue |
|---|---|---|---|---|
| Pore gazeux | Gas trapped in the atomised powder or released during melting | Spherical, small, scattered | Good contrast, the most favourable case | Moderate in the core, worse near the surface |
| Keyhole | Excessive linear energy, collapse of the vapour capillary | Almost spherical, deep, often aligned | Adequate above the threshold, unfavourable position at depth | High when the pores line up along a scan track |
| Lack of fusion | Insufficient overlap between tracks or between layers | Flat, irregular, closed, sometimes containing unmelted powder | The worst: small thickness crossed, contrast lost in the noise | The highest: behaves like a pre-existing crack |
The voxel sets the first limit
Tomography reconstructs a volume in voxels whose size depends on magnification: the closer the object is to the source, the finer the voxel. But the object must fit in the measurement field: a bulky part moves away from the source, and the voxel size increases proportionally. In practice, a test specimen of a few millimeters is imaged with voxels of a few microns, while a fitting of several tens of centimeters requires voxels in the hundreds of microns. And a voxel isn’t a threshold: to stand out from reconstruction noise with usable reliability, an indication must typically extend over several voxels. The smallest reliable defect on a full part is therefore in the hundreds of microns, while the process metallurgy commonly produces defects in the tens.
Slicing the examination into regions improves local resolution, at the cost of machine time and delicate realignments; serious inspection plans therefore reserve high resolution for critical zones rather than promising a « finely seen » entire volume. Another methodological consequence: unlike dye penetrant or ultrasonic testing on forged parts, tomography of additive parts has no old foundation of probability of detection curves. Each combination of system, material, and geometry must build its own, typically from parts with induced defects—and until this demonstration exists, the « threshold » announced is just a nominal resolution.
Contrast, the other half of the threshold
Contrast says what the machine distinguishes. An indication only exists if the attenuation along the ray differs enough from the surroundings to stand out from the noise, and this difference is proportional to the path length through the void. A spherical pore offers the ray a path of void equal to its diameter; an incomplete fusion of the same volume, spread into a thin disk, only offers a few microns to the ray crossing it perpendicularly. At equal volume, the signal collapses.
Material effects are added. Dense alloys harden the beam—nickel-based superalloys much more than titanium, which in turn is more than aluminum—and thick sections starve the detector of photons, degrading the contrast-to-noise ratio where the parts are massive. Artifacts near abrupt thickness changes blur the reading in fillets and connections—often the most stressed zones. The actual threshold is therefore never a single number: it varies within the volume of the same part, at its worst where the analysis needs it most.
The trap: reading « no indication » as « no defect. » A tomography report only makes sense with its conditions: voxel size, segmentation threshold, part orientation in the beam. The most harmful defect, tight incomplete fusion, is precisely the one that produces the least contrast—the absence of indication is compatible with its presence.
The defect that sizes fatigue is below the threshold
Fatigue initiation depends on the largest defect encountered by the most stressed zones, and equivalent size approaches link the fatigue limit to the square root of the projected area of the defect. The resulting diagram has a known shape: a plateau for very small defects, then a continuous decrease. The whole question is whether the detection threshold falls to the left or the right of the knee. On finely imaged test specimens, it falls to the left: the invisible doesn’t change the strength. On full-scale parts, it often falls to the right: a population of defects then lowers the fatigue limit without producing an indication.
The position worsens the picture: a surface or subsurface defect initiates earlier than a core defect, and artifacts are most troublesome near surfaces. Then there’s hot isostatic pressing, often presented as the solution. It closes internal pores and tightens fatigue dispersion, but it doesn’t heal surface-breaking defects, which the press gas can’t compress, and it doesn’t dispense with control: argon pores that have been closed can reopen during subsequent heat exposures—the phenomenon is documented under the name thermally induced porosity. A treatment that erases the indication without guaranteeing the mechanism shifts the problem, it doesn’t eliminate it.
When you can’t see everything, you control what produces
Process control is key when inspection isn’t perfect. The certification reasoning draws the consequence: if final inspection can’t guarantee defect absence, the process must ensure defects stay within calculation assumptions. This leads to a classic architecture: qualification that freezes machine, material, parameters, and scanning strategy—any change requires requalification. The powder itself is controlled: traced batches, particle size distribution, chemistry, and bounded reuse rate, because oxygen and humidity during recycling affect defect populations.
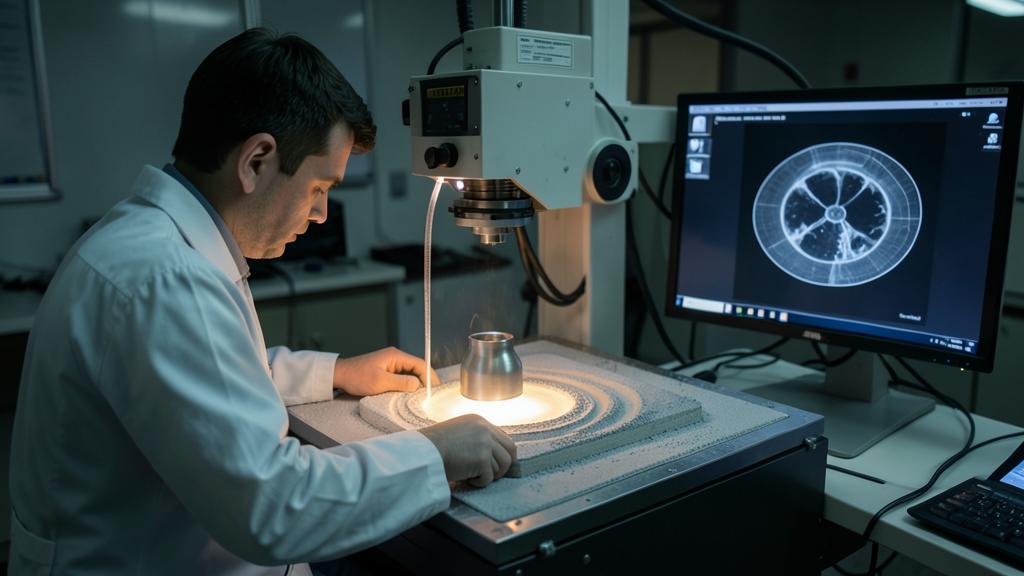
The scheme isn’t new—composite structures use similar logic. Powder bed fusion inherits this directly. Each production includes witness specimens (density cubes, tensile/fatigue samples) built in the same batch to verify process consistency. Periodic destructive cuts check what witnesses and imaging can’t prove.
In-process monitoring completes the structure: photodiodes on the melt pool, bed imaging after recoating, and layer-by-layer anomaly maps. It detects defects as they form, at scales tomography can’t reach on finished parts. But correlation between alarms and real defects must be demonstrated—today, this limits certification credit.
The right reflex: compare two numbers—the smallest defect reliably detected in the considered zone, and the initial defect size assumed by the damage tolerance or fatigue calculation. If the second is smaller, compliance rests on the process, not on the inspection: it’s the qualification file and the monitoring plan that need to be audited, not just the NDT report.
What to go check in your own reference
For those who operate, certify, or audit these parts, three concrete verifications are worth more than an opinion on tomography. The first: the consistency between the initial defect size assumed by the damage tolerance analysis or fatigue reduction, and the smallest defect actually reliably detectable by the inspection method in the considered zone—not the nominal resolution of the commercial documentation. The second: the status of the witness specimens in the file—position on the platform, build orientation, heat treatment undergone with or separately from the parts—because a non-representative witness mainly proves that a witness was manufactured. The third: the feedback loop—what concretely triggers an in-situ monitoring alarm, a density drift on a witness cube, an indication at the threshold limit? A system where the answer is « nothing formalized » has an inspection plan, not a process control. Remains the gray area: the credit to be given to in-situ monitoring as a compliance means in its own right—that’s probably where the next decade of additive part control will be played.
The applicable requirements, the specifications retained in the certification file, and the approved documentation of the approval holder prevail in all circumstances over the orders of magnitude and reasoning of this article.


Leave a Reply
You must be logged in to post a comment.